


You are looking at the documentation of a prior release. To read the documentation of the latest release, please
visit here.
New to KubeDB? Please start here.
Using Prometheus with KubeDB
This tutorial will show you how to monitor KubeDB databases using Prometheus.
Before You Begin
At first, you need to have a Kubernetes cluster, and the kubectl command-line tool must be configured to communicate with your cluster. If you do not already have a cluster, you can create one by using Minikube.
Now, install KubeDB cli on your workstation and KubeDB operator in your cluster following the steps here.
To keep things isolated, this tutorial uses a separate namespace called demo throughout this tutorial. Run the following command to prepare your cluster for this tutorial:
$ kubectl create -f https://raw.githubusercontent.com/kubedb/cli/0.8.0-beta.2/docs/examples/redis/demo-0.yaml
namespace "demo" created

$ kubectl get ns
NAME          STATUS    AGE
default       Active    45m
demo          Active    10s
kube-public   Active    45m
kube-system   Active    45m
Note that the yaml files that are used in this tutorial, stored in docs/examples folder in GitHub repository kubedb/cli.
Create a Redis database
KubeDB implements a Redis CRD to define the specification of a Redis database. Below is the Redis object created in this tutorial.
apiVersion: kubedb.com/v1alpha1
kind: Redis
metadata:
  name: redis-mon-prometheus
  namespace: demo
spec:
  version: 4
  storage:
    storageClassName: "standard"
    accessModes:
    - ReadWriteOnce
    resources:
      requests:
        storage: 50Mi
  monitor:
    agent: prometheus.io/builtin
$ kubedb create -f https://raw.githubusercontent.com/kubedb/cli/0.8.0-beta.2/docs/examples/redis/monitoring/builtin-prometheus/demo-1.yaml
validating "https://raw.githubusercontent.com/kubedb/cli/0.8.0-beta.2/docs/examples/redis/monitoring/builtin-prometheus/demo-1.yaml"
redis "redis-mon-prometheus" created
Here,
spec.versionis the version of Redis database. In this tutorial, a Redis 3.4 database is going to be created.spec.storagespecifies the StorageClass of PVC dynamically allocated to store data for this database. This storage spec will be passed to the StatefulSet created by KubeDB operator to run database pods. You can specify any StorageClass available in your cluster with appropriate resource requests. If no storage spec is given, anemptyDiris used.spec.monitorspecifies that built-in Prometheus is used to monitor this database instance. KubeDB operator will configure the service of this database in a way that the Prometheus server will automatically find out the service endpoint akaRedis Exporterand will receive metrics from exporter.
KubeDB operator watches for Redis objects using Kubernetes api. When a Redis object is created, KubeDB operator will create a new StatefulSet and a ClusterIP Service with the matching crd name. KubeDB operator will also create a governing service for StatefulSets with the name kubedb, if one is not already present.
$ kubedb get rd -n demo
NAME                   STATUS    AGE
redis-mon-prometheus   Running   3m

$ kubedb describe rd -n demo redis-mon-prometheus
Name:		redis-mon-prometheus
Namespace:	demo
StartTimestamp:	Mon, 12 Feb 2018 17:21:08 +0600
Status:		Running
Volume:
  StorageClass:	standard
  Capacity:	50Mi
  Access Modes:	RWO

StatefulSet:
  Name:			redis-mon-prometheus
  Replicas:		1 current / 1 desired
  CreationTimestamp:	Mon, 12 Feb 2018 17:21:10 +0600
  Pods Status:		1 Running / 0 Waiting / 0 Succeeded / 0 Failed

Service:
  Name:		redis-mon-prometheus
  Type:		ClusterIP
  IP:		10.108.237.53
  Port:		db		6379/TCP
  Port:		prom-http	56790/TCP

Monitoring System:
  Agent:	prometheus.io/builtin
  Prometheus:
    Namespace:
    Interval:

Events:
  FirstSeen   LastSeen   Count     From             Type       Reason       Message
  ---------   --------   -----     ----             --------   ------       -------
  3m          3m         1         Redis operator   Normal     Successful   Successfully patched StatefulSet
  3m          3m         1         Redis operator   Normal     Successful   Successfully patched Redis
  3m          3m         1         Redis operator   Normal     Successful   Successfully created StatefulSet
  3m          3m         1         Redis operator   Normal     Successful   Successfully created Redis
  4m          4m         1         Redis operator   Normal     Successful   Successfully created Service
Since spec.monitoring was configured, the database service object is configured accordingly. You can verify it running the following commands:
$ kubectl get services -n demo
NAME                   TYPE        CLUSTER-IP      EXTERNAL-IP   PORT(S)              AGE
kubedb                 ClusterIP   None            <none>        <none>               12m
redis-mon-prometheus   ClusterIP   10.108.237.53   <none>        6379/TCP,56790/TCP   12m
$ kubectl get services redis-mon-prometheus -n demo -o yaml
apiVersion: v1
kind: Service
metadata:
  annotations:
    monitoring.appscode.com/agent: prometheus.io/builtin
    prometheus.io/path: /kubedb.com/v1alpha1/namespaces/demo/redises/redis-mon-prometheus/metrics
    prometheus.io/port: "56790"
    prometheus.io/scrape: "true"
  creationTimestamp: 2018-02-12T11:21:09Z
  labels:
    kubedb.com/kind: Redis
    kubedb.com/name: redis-mon-prometheus
  name: redis-mon-prometheus
  namespace: demo
  resourceVersion: "48437"
  selfLink: /api/v1/namespaces/demo/services/redis-mon-prometheus
  uid: d337a61e-0fe6-11e8-a2d6-08002751ae8c
spec:
  clusterIP: 10.108.237.53
  ports:
  - name: db
    port: 6379
    protocol: TCP
    targetPort: db
  - name: prom-http
    port: 56790
    protocol: TCP
    targetPort: prom-http
  selector:
    kubedb.com/kind: Redis
    kubedb.com/name: redis-mon-prometheus
  sessionAffinity: None
  type: ClusterIP
status:
  loadBalancer: {}
We can see that the service contains these specific annotations. The Prometheus server will discover the exporter using these specifications.
prometheus.io/path: ...
prometheus.io/port: ...
prometheus.io/scrape: ...
Deploy and configure Prometheus Server
The Prometheus server is needed to configure so that it can discover endpoints of services. If a Prometheus server is already running in cluster and if it is configured in a way that it can discover service endpoints, no extra configuration will be needed. If there is no existing Prometheus server running, rest of this tutorial will create a Prometheus server with appropriate configuration.
The configuration file to Prometheus-Server will be provided by ConfigMap. The below config map will be created:
apiVersion: v1
kind: ConfigMap
metadata:
  name: prometheus-server-conf
  labels:
    name: prometheus-server-conf
  namespace: demo
data:
  prometheus.yml: |-
    global:
      scrape_interval: 5s
      evaluation_interval: 5s
    scrape_configs:
    - job_name: 'kubernetes-service-endpoints'

      kubernetes_sd_configs:
      - role: endpoints

      relabel_configs:
      - source_labels: [__meta_kubernetes_service_annotation_prometheus_io_scrape]
        action: keep
        regex: true
      - source_labels: [__meta_kubernetes_service_annotation_prometheus_io_scheme]
        action: replace
        target_label: __scheme__
        regex: (https?)
      - source_labels: [__meta_kubernetes_service_annotation_prometheus_io_path]
        action: replace
        target_label: __metrics_path__
        regex: (.+)
      - source_labels: [__address__, __meta_kubernetes_service_annotation_prometheus_io_port]
        action: replace
        target_label: __address__
        regex: ([^:]+)(?::\d+)?;(\d+)
        replacement: $1:$2
      - action: labelmap
        regex: __meta_kubernetes_service_label_(.+)
      - source_labels: [__meta_kubernetes_namespace]
        action: replace
        target_label: kubernetes_namespace
      - source_labels: [__meta_kubernetes_service_name]
        action: replace
        target_label: kubernetes_name
$ kubectl create -f https://raw.githubusercontent.com/kubedb/cli/0.8.0-beta.2/docs/examples/monitoring/builtin-prometheus/demo-1.yaml
configmap "prometheus-server-conf" created
Now, the below yaml is used to deploy Prometheus in kubernetes :
apiVersion: apps/v1
kind: Deployment
metadata:
  name: prometheus-server
  namespace: demo
spec:
  replicas: 1
  selector:
    matchLabels:
      app: prometheus-server
  template:
    metadata:
      labels:
        app: prometheus-server
    spec:
      containers:
        - name: prometheus
          image: prom/prometheus:v2.1.0
          args:
            - "--config.file=/etc/prometheus/prometheus.yml"
            - "--storage.tsdb.path=/prometheus/"
          ports:
            - containerPort: 9090
          volumeMounts:
            - name: prometheus-config-volume
              mountPath: /etc/prometheus/
            - name: prometheus-storage-volume
              mountPath: /prometheus/
      volumes:
        - name: prometheus-config-volume
          configMap:
            defaultMode: 420
            name: prometheus-server-conf
        - name: prometheus-storage-volume
          emptyDir: {}
In RBAC enabled cluster
If RBAC is enabled, Run the following command to deploy prometheus in kubernetes:
$ kubectl create -f https://raw.githubusercontent.com/kubedb/cli/0.8.0-beta.2/docs/examples/monitoring/builtin-prometheus/rbac/demo-2.yaml
clusterrole "prometheus-server" created
serviceaccount "prometheus-server" created
clusterrolebinding "prometheus-server" created
deployment "prometheus-server" created
service "prometheus-service" created

# Verify RBAC stuffs
$ kubectl get clusterroles
NAME                AGE
prometheus-server   57s

$ kubectl get clusterrolebindings
NAME                AGE
prometheus-server   1m


$ kubectl get serviceaccounts -n demo
NAME                SECRETS   AGE
default             1         48m
prometheus-server   1         1m
In RBAC *not* enabled cluster
If RBAC is not enabled, Run the following command to prepare your cluster for this tutorial:
$ kubectl create -f https://raw.githubusercontent.com/kubedb/cli/0.8.0-beta.2/docs/examples/monitoring/builtin-prometheus/demo-2.yaml
deployment "prometheus-server" created
service "prometheus-service" created


$ kubectl get pods -n demo
NAME                                 READY     STATUS    RESTARTS   AGE
prometheus-server-79c7cf44fc-xgjp7   1/1       Running   0          26s
redis-mon-prometheus-0               2/2       Running   0          13m
Prometheus Dashboard
Now to open prometheus dashboard on Browser:
$ kubectl get svc -n demo
NAME                   TYPE           CLUSTER-IP       EXTERNAL-IP   PORT(S)              AGE
kubedb                 ClusterIP      None             <none>        <none>               14m
prometheus-service     LoadBalancer   10.103.108.241   <pending>     9090:30901/TCP       51s
redis-mon-prometheus   ClusterIP      10.108.237.53    <none>        6379/TCP,56790/TCP   14m


$ minikube ip
192.168.99.100

$ minikube service prometheus-service -n demo --url
http://192.168.99.100:30901
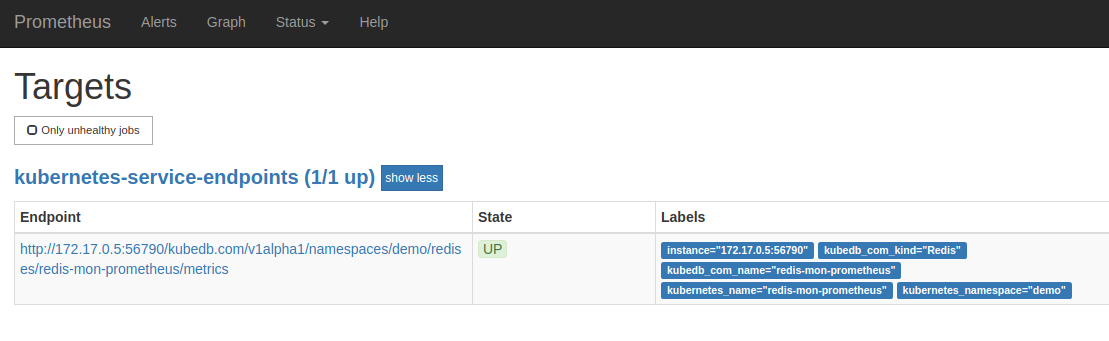
Now, open your browser and go to the following URL: http://{minikube-ip}:{prometheus-svc-nodeport} to visit Prometheus Dashboard. According to the above example, this URL will be http://192.168.99.100:30901.
Now, if you go the Prometheus Dashboard, you should see that this database endpoint as one of the targets.
Cleaning up
To cleanup the Kubernetes resources created by this tutorial, run:
$ kubedb delete rd,drmn -n demo --all --force

# In rbac enabled cluster,
# $ kubectl delete clusterrole prometheus-server
# $ kubectl delete clusterrolebindings  prometheus-server
# $ kubectl delete serviceaccounts -n demo  prometheus-server

$ kubectl delete ns demo
namespace "demo" deleted
Next Steps
- Monitor your Redis database with KubeDB using out-of-the-box CoreOS Prometheus Operator.
- Detail concepts of Redis object.
- Use private Docker registry to deploy Redis with KubeDB.
- Wondering what features are coming next? Please visit here.
- Want to hack on KubeDB? Check our contribution guidelines.