


You are looking at the documentation of a prior release. To read the documentation of the latest release, please
visit here.
New to KubeDB? Please start here.
Using Prometheus (CoreOS operator) with KubeDB
This tutorial will show you how to monitor KubeDB databases using Prometheus via CoreOS Prometheus Operator.
Before You Begin
At first, you need to have a Kubernetes cluster, and the kubectl command-line tool must be configured to communicate with your cluster. If you do not already have a cluster, you can create one by using Minikube.
Now, install KubeDB cli on your workstation and KubeDB operator in your cluster following the steps here.
To keep things isolated, this tutorial uses a separate namespace called demo throughout this tutorial.
Note that the yaml files that are used in this tutorial, stored in docs/examples folder in GitHub repository kubedb/cli.
Deploy CoreOS-Prometheus Operator
In RBAC enabled cluster
If RBAC is enabled, Run the following command to prepare your cluster for this tutorial:
$ kubectl create -f https://raw.githubusercontent.com/kubedb/cli/0.8.0-rc.0/docs/examples/monitoring/coreos-operator/rbac/demo-0.yaml
namespace "demo" created
clusterrole "prometheus-operator" created
serviceaccount "prometheus-operator" created
clusterrolebinding "prometheus-operator" created
deployment "prometheus-operator" created

$ kubectl get pods -n demo --watch
NAME                                   READY     STATUS    RESTARTS   AGE
prometheus-operator-79cb9dcd4b-2njgq   1/1       Running   0          2m


$ kubectl get crd
NAME                                    AGE
alertmanagers.monitoring.coreos.com     11m
prometheuses.monitoring.coreos.com      11m
servicemonitors.monitoring.coreos.com   11m
Once the Prometheus operator CRDs are registered, run the following command to create a Prometheus.
$ kubectl create -f https://raw.githubusercontent.com/kubedb/cli/0.8.0-rc.0/docs/examples/monitoring/coreos-operator/rbac/demo-1.yaml
clusterrole "prometheus" created
serviceaccount "prometheus" created
clusterrolebinding "prometheus" created
prometheus "prometheus" created
service "prometheus" created

# Verify RBAC stuffs
$ kubectl get clusterroles
NAME                  AGE
prometheus            48s
prometheus-operator   1m


$ kubectl get clusterrolebindings
NAME                  AGE
prometheus            7s
prometheus-operator   25s


$ kubectl get serviceaccounts -n demo
NAME                  SECRETS   AGE
default               1         5m
prometheus            1         4m
prometheus-operator   1         5m
In RBAC *not* enabled cluster
If RBAC is not enabled, Run the following command to prepare your cluster for this tutorial:
$ kubectl create -f https://raw.githubusercontent.com/kubedb/cli/0.8.0-rc.0/docs/examples/monitoring/coreos-operator/demo-0.yaml
namespace "demo" created
deployment "prometheus-operator" created


$ kubectl get pods -n demo --watch
NAME                                   READY     STATUS              RESTARTS   AGE
prometheus-operator-5dcd844486-nprmk   0/1       ContainerCreating   0          27s
prometheus-operator-5dcd844486-nprmk   1/1       Running   0         46s


$ kubectl get crd
NAME                                    AGE
alertmanagers.monitoring.coreos.com     45s
prometheuses.monitoring.coreos.com      44s
servicemonitors.monitoring.coreos.com   44s
Once the Prometheus operator CRDs are registered, run the following command to create a Prometheus.
$ kubectl create -f https://raw.githubusercontent.com/kubedb/cli/0.8.0-rc.0/docs/examples/monitoring/coreos-operator/demo-1.yaml
prometheus "prometheus" created
service "prometheus" created
Prometheus Dashboard
Now to open prometheus dashboard on Browser:
$ kubectl get svc -n demo
NAME                  TYPE           CLUSTER-IP       EXTERNAL-IP   PORT(S)          AGE
prometheus            LoadBalancer   10.110.173.135   <pending>     9090:30900/TCP   11s
prometheus-operated   ClusterIP      None             <none>        9090/TCP         11s


$ minikube ip
192.168.99.100

$ minikube service prometheus -n demo --url
http://192.168.99.100:30900
Now, open your browser and go to the following URL: http://{minikube-ip}:{prometheus-svc-nodeport} to visit Prometheus Dashboard. According to the above example, this URL will be http://192.168.99.100:30900.
Create a Redis database
KubeDB implements a Redis CRD to define the specification of a Redis database. Below is the Redis object created in this tutorial.
apiVersion: kubedb.com/v1alpha1
kind: Redis
metadata:
  name: redis-mon-coreos
  namespace: demo
spec:
  version: "4"
  storage:
    storageClassName: "standard"
    accessModes:
    - ReadWriteOnce
    resources:
      requests:
        storage: 50Mi
  monitor:
    agent: prometheus.io/coreos-operator
    prometheus:
      namespace: demo
      labels:
        app: kubedb
      interval: 10s
The Redis CRD object contains monitor field in it’s spec. It is also possible to add CoreOS-Prometheus monitor to an existing Redis database by adding the below part in it’s spec field.
spec:
  monitor:
    agent: prometheus.io/coreos-operator
    prometheus:
      namespace: demo
      labels:
        app: kubedb
      interval: 10s
| Keys | Value | Description |
|---|---|---|
spec.monitor.agent | string | Required. Indicates the monitoring agent used. Only valid value currently is coreos-prometheus-operator |
spec.monitor.prometheus.namespace | string | Required. Indicates namespace where service monitors are created. This must be the same namespace of the Prometheus instance. |
spec.monitor.prometheus.labels | map | Required. Indicates labels applied to service monitor. |
spec.monitor.prometheus.interval | string | Optional. Indicates the scrape interval for database exporter endpoint (eg, ’10s') |
spec.monitor.prometheus.port | int | Optional. Indicates the port for database exporter endpoint (default is 56790) |
Known Limitations: If the database password is updated, exporter must be restarted to use the new credentials. This issue is tracked here.
Run the following command to deploy the above Redis CRD object.
$ kubedb create -f https://raw.githubusercontent.com/kubedb/cli/0.8.0-rc.0/docs/examples/redis/monitoring/coreos-operator/demo-1.yaml
redis "redis-mon-coreos" created
Here,
spec.versionis the version of Redis database. In this tutorial, a Redis 4 database is going to be created.spec.storagespecifies the StorageClass of PVC dynamically allocated to store data for this database. This storage spec will be passed to the StatefulSet created by KubeDB operator to run database pods. You can specify any StorageClass available in your cluster with appropriate resource requests. Since release 0.8.0-rc.0, a storage spec is required for Redis.spec.monitorspecifies that CoreOS Prometheus operator is used to monitor this database instance. A ServiceMonitor should be created in thedemonamespace with labelapp=kubedb. The exporter endpoint should be scrapped every 10 seconds.
KubeDB operator watches for Redis objects using Kubernetes api. When a Redis object is created, KubeDB operator will create a new StatefulSet and a ClusterIP Service with the matching crd name. KubeDB operator will also create a governing service for StatefulSets with the name kubedb, if one is not already present.
$ kubedb get rd -n demo
NAME               STATUS    AGE
redis-mon-coreos   Creating  36s

$ kubedb get rd -n demo
NAME               STATUS    AGE
redis-mon-coreos   Running   26s


$ kubedb describe rd -n demo redis-mon-coreos
Name:		redis-mon-coreos
Namespace:	demo
StartTimestamp:	Mon, 12 Feb 2018 17:12:03 +0600
Status:		Running
Volume:
  StorageClass:	standard
  Capacity:	50Mi
  Access Modes:	RWO

StatefulSet:
  Name:			redis-mon-coreos
  Replicas:		1 current / 1 desired
  CreationTimestamp:	Mon, 12 Feb 2018 17:12:05 +0600
  Pods Status:		1 Running / 0 Waiting / 0 Succeeded / 0 Failed

Service:
  Name:		redis-mon-coreos
  Type:		ClusterIP
  IP:		10.108.164.193
  Port:		db		6379/TCP
  Port:		prom-http	56790/TCP

Monitoring System:
  Agent:	prometheus.io/coreos-operator
  Prometheus:
    Namespace:	demo
    Labels:	app=kubedb
    Interval:	10s

Events:
  FirstSeen   LastSeen   Count     From             Type       Reason       Message
  ---------   --------   -----     ----             --------   ------       -------
  46s         46s        1         Redis operator   Normal     Successful   Successfully patched StatefulSet
  46s         46s        1         Redis operator   Normal     Successful   Successfully patched Redis
  48s         48s        1         Redis operator   Normal     Successful   Successfully created StatefulSet
  48s         48s        1         Redis operator   Normal     Successful   Successfully created Redis
  1m          1m         1         Redis operator   Normal     Successful   Successfully created Service
Since spec.monitoring was configured, a ServiceMonitor object is created accordingly. You can verify it running the following commands:
$ kubectl get servicemonitor -n demo
NAME                           AGE
kubedb-demo-redis-mon-coreos   1m


$ kubectl get servicemonitor -n demo kubedb-demo-redis-mon-coreos -o yaml
apiVersion: monitoring.coreos.com/v1
kind: ServiceMonitor
metadata:
  clusterName: ""
  creationTimestamp: 2018-02-12T11:12:20Z
  labels:
    app: kubedb
    monitoring.appscode.com/service: redis-mon-coreos.demo
  name: kubedb-demo-redis-mon-coreos
  namespace: demo
  resourceVersion: "47974"
  selfLink: /apis/monitoring.coreos.com/v1/namespaces/demo/servicemonitors/kubedb-demo-redis-mon-coreos
  uid: 9824ef63-0fe5-11e8-a2d6-08002751ae8c
spec:
  endpoints:
  - interval: 10s
    path: /kubedb.com/v1alpha1/namespaces/demo/redises/redis-mon-coreos/metrics
    port: prom-http
    targetPort: 0
  namespaceSelector:
    matchNames:
    - demo
  selector:
    matchLabels:
      kubedb.com/kind: Redis
      kubedb.com/name: redis-mon-coreos
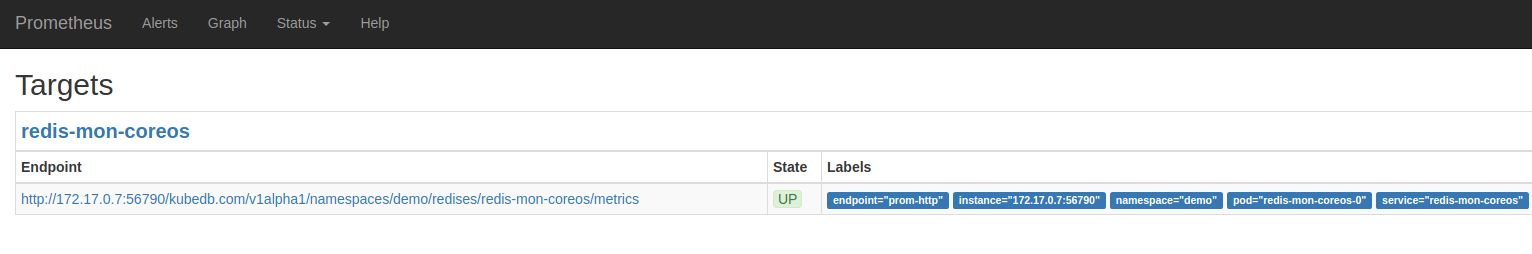
Now, if you go the Prometheus Dashboard, you should see that this database endpoint as one of the targets.
Cleaning up
To cleanup the Kubernetes resources created by this tutorial, run:
$ kubectl patch -n demo rd/redis-mon-coreos -p '{"spec":{"doNotPause":false}}' --type="merge"
$ kubectl delete -n demo rd/redis-mon-coreos

$ kubectl patch -n demo drmn/redis-mon-coreos -p '{"spec":{"wipeOut":true}}' --type="merge"
$ kubectl delete -n demo drmn/redis-mon-coreos

# In rbac enabled cluster,
# $ kubectl delete clusterrolebindings prometheus-operator  prometheus
# $ kubectl delete clusterrole prometheus-operator prometheus

$ kubectl delete ns demo
namespace "demo" deleted
Next Steps
- Monitor your Redis database with KubeDB using out-of-the-box builtin-Prometheus.
- Detail concepts of Redis object.
- Use private Docker registry to deploy Redis with KubeDB.
- Wondering what features are coming next? Please visit here.
- Want to hack on KubeDB? Check our contribution guidelines.