


You are looking at the documentation of a prior release. To read the documentation of the latest release, please
visit here.
New to KubeDB? Please start here.
Using Prometheus (CoreOS operator) with KubeDB
This tutorial will show you how to monitor PostgreSQL using Prometheus via CoreOS Prometheus Operator.
Before You Begin
At first, you need to have a Kubernetes cluster, and the kubectl command-line tool must be configured to communicate with your cluster. If you do not already have a cluster, you can create one by using minikube.
Now, install KubeDB cli on your workstation and KubeDB operator in your cluster following the steps here.
To keep things isolated, this tutorial uses a separate namespace called demo throughout this tutorial.
$ kubectl create ns demo
namespace "demo" created
Note: Yaml files used in this tutorial are stored in docs/examples/postgres folder in GitHub repository kubedb/cli.
This tutorial assumes that you are familiar with PostgreSQL concept.
Deploy CoreOS-Prometheus Operator
Run the following command to deploy CoreOS-Prometheus operator.
$ kubectl create -f https://raw.githubusercontent.com/kubedb/cli/0.9.0-rc.0/docs/examples/monitoring/coreos-operator/demo-0.yaml
namespace/demo created
clusterrole.rbac.authorization.k8s.io/prometheus-operator created
serviceaccount/prometheus-operator created
clusterrolebinding.rbac.authorization.k8s.io/prometheus-operator created
deployment.extensions/prometheus-operator created
Wait for running the Deployment’s Pods.
$ kubectl get pods -n demo
NAME                                   READY     STATUS    RESTARTS   AGE
prometheus-operator-857455484c-7xwxt   1/1       Running   0          2m
This CoreOS-Prometheus operator will create some supported Custom Resource Definition (CRD).
$ kubectl get crd
NAME                                          CREATED AT
...
alertmanagers.monitoring.coreos.com           2018-09-24T12:42:22Z
prometheuses.monitoring.coreos.com            2018-09-24T12:42:22Z
servicemonitors.monitoring.coreos.com         2018-09-24T12:42:22Z
...
Once the Prometheus operator CRDs are registered, run the following command to create a Prometheus.
$ kubectl create -f https://raw.githubusercontent.com/kubedb/cli/0.9.0-rc.0/docs/examples/monitoring/coreos-operator/demo-1.yaml
clusterrole.rbac.authorization.k8s.io/prometheus created
serviceaccount/prometheus created
clusterrolebinding.rbac.authorization.k8s.io/prometheus created
prometheus.monitoring.coreos.com/prometheus created
service/prometheus created
Verify RBAC stuffs
$ kubectl get clusterroles
NAME                      AGE
...
prometheus                42s
prometheus-operator       4m
...
$ kubectl get clusterrolebindings
NAME                      AGE
...
prometheus                1m
prometheus-operator       5m
...
Prometheus Dashboard
Now open prometheus dashboard on browser by running minikube service prometheus -n demo.
Or you can get the URL of prometheus Service by running following command
$ minikube service prometheus -n demo --url
http://192.168.99.100:30900
If you are not using minikube, browse prometheus dashboard using following address http://{Node's ExternalIP}:{NodePort of prometheus-service}.
Monitor PostgreSQL with CoreOS Prometheus
apiVersion: kubedb.com/v1alpha1
kind: Postgres
metadata:
  name: coreos-prom-postgres
  namespace: demo
spec:
  version: "9.6-v1"
  storage:
    storageClassName: "standard"
    accessModes:
    - ReadWriteOnce
    resources:
      requests:
        storage: 50Mi
  monitor:
    agent: prometheus.io/coreos-operator
    prometheus:
      namespace: demo
      labels:
        app: kubedb
      interval: 10s
Here,
monitor.agentindicates the monitoring agent. Currently only valid value currently iscoreos-prometheus-operatormonitor.prometheusspecifies the information for monitoring by prometheusprometheus.namespacespecifies the namespace where ServiceMonitor is created.prometheus.labelsspecifies the labels applied to ServiceMonitor.prometheus.portindicates the port for PostgreSQL exporter endpoint (default is56790)prometheus.intervalindicates the scraping interval (eg, ’10s')
Now create PostgreSQL with monitoring spec
$ kubectl create -f https://raw.githubusercontent.com/kubedb/cli/0.9.0-rc.0/docs/examples/postgres/monitoring/coreos-prom-postgres.yaml
postgres.kubedb.com/coreos-prom-postgres created
KubeDB operator will create a ServiceMonitor object once the PostgreSQL is successfully running.
$ kubectl get servicemonitor -n demo
NAME                               AGE
kubedb-demo-coreos-prom-postgres   23s
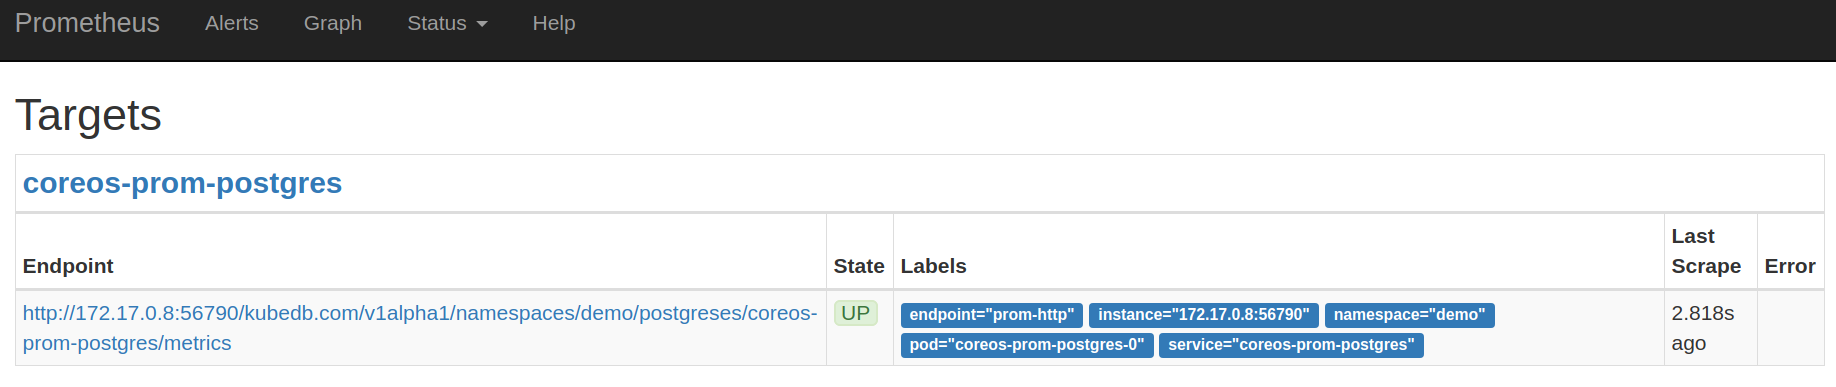
Now, if you go the Prometheus Dashboard, you should see that this database endpoint as one of the targets.
Cleaning up
To cleanup the Kubernetes resources created by this tutorial, run:
$ kubectl patch -n demo pg/coreos-prom-postgres -p '{"spec":{"terminationPolicy":"WipeOut"}}' --type="merge"
$ kubectl delete -n demo pg/coreos-prom-postgres

$ kubectl delete clusterrolebindings prometheus-operator  prometheus
$ kubectl delete clusterrole prometheus-operator prometheus

$ kubectl delete ns demo
Next Steps
- Monitor your PostgreSQL database with KubeDB using built-in Prometheus.
- Wondering what features are coming next? Please visit here.
- Want to hack on KubeDB? Check our contribution guidelines.