


You are looking at the documentation of a prior release. To read the documentation of the latest release, please
visit here.
New to KubeDB? Please start here.
Using Prometheus (CoreOS operator) with KubeDB
This tutorial will show you how to monitor KubeDB databases using Prometheus via CoreOS Prometheus Operator.
Before You Begin
At first, you need to have a Kubernetes cluster, and the kubectl command-line tool must be configured to communicate with your cluster. If you do not already have a cluster, you can create one by using Minikube.
Now, install KubeDB cli on your workstation and KubeDB operator in your cluster following the steps here.
To keep things isolated, this tutorial uses a separate namespace called
demothroughout this tutorial.$ kubectl create ns demo namespace "demo" created $ kubectl get ns NAME STATUS AGE demo Active 10s
Note: The yaml files used in this tutorial are stored in docs/examples/redis folder in GitHub repository kubedb/cli.
Deploy CoreOS-Prometheus Operator
Run the following command to deploy CoreOS-Prometheus operator.
$ kubectl create -f https://raw.githubusercontent.com/kubedb/cli/0.9.0-rc.2/docs/examples/monitoring/coreos-operator/demo-0.yaml
namespace/demo created
clusterrole.rbac.authorization.k8s.io/prometheus-operator created
serviceaccount/prometheus-operator created
clusterrolebinding.rbac.authorization.k8s.io/prometheus-operator created
deployment.extensions/prometheus-operator created
Wait for running the Deployment’s Pods.
$ kubectl get pods -n demo
NAME                                   READY     STATUS    RESTARTS   AGE
prometheus-operator-857455484c-45clv   1/1       Running   0          5m
This CoreOS-Prometheus operator will create some supported Custom Resource Definition (CRD).
$ kubectl get crd
NAME                                          CREATED AT
...
alertmanagers.monitoring.coreos.com           2018-09-24T12:42:22Z
prometheuses.monitoring.coreos.com            2018-09-24T12:42:22Z
servicemonitors.monitoring.coreos.com         2018-09-24T12:42:22Z
...
Once the Prometheus operator CRDs are registered, run the following command to create a Prometheus.
$ kubectl create -f https://raw.githubusercontent.com/kubedb/cli/0.9.0-rc.2/docs/examples/monitoring/coreos-operator/demo-1.yaml
clusterrole.rbac.authorization.k8s.io/prometheus created
serviceaccount/prometheus created
clusterrolebinding.rbac.authorization.k8s.io/prometheus created
prometheus.monitoring.coreos.com/prometheus created
service/prometheus created

# Verify RBAC stuffs
$ kubectl get clusterroles
NAME                  AGE
prometheus            48s
prometheus-operator   1m

$ kubectl get clusterrolebindings
NAME                  AGE
prometheus            7s
prometheus-operator   25s

$ kubectl get serviceaccounts -n demo
NAME                  SECRETS   AGE
default               1         5m
prometheus            1         4m
prometheus-operator   1         5m
Prometheus Dashboard
Now to open prometheus dashboard on Browser:
$ kubectl get svc -n demo
NAME                  TYPE           CLUSTER-IP      EXTERNAL-IP   PORT(S)          AGE
prometheus            LoadBalancer   10.101.136.37   <pending>     9090:30900/TCP   7s
prometheus-operated   ClusterIP      None            <none>        9090/TCP         6s

$ minikube ip
192.168.99.100

$ minikube service prometheus -n demo --url
http://192.168.99.100:30900
Now, open your browser and go to the following URL: http://{minikube-ip}:{prometheus-svc-nodeport} to visit Prometheus Dashboard. According to the above example, this URL will be http://192.168.99.100:30900.
If you are not using minikube, browse prometheus dashboard using following address http://{Node's ExternalIP}:{NodePort of prometheus-service}.
Find out required label for ServiceMonitor
First, check created objects of Prometheus kind.
$ kubectl get prometheus --all-namespaces
NAMESPACE   NAME         AGE
demo        prometheus   20m
Now if we see the full spec of prometheus of Prometheus kind, we will see a field called serviceMonitorSelector. The value of matchLabels under serviceMonitorSelector part, is the required label for KubeDB monitoring spec monitor.prometheus.labels.
 $ kubectl get prometheus -n demo prometheus -o yaml
apiVersion: monitoring.coreos.com/v1
kind: Prometheus
metadata:
  creationTimestamp: 2018-11-15T10:40:57Z
  generation: 1
  name: prometheus
  namespace: demo
  resourceVersion: "1661"
  selfLink: /apis/monitoring.coreos.com/v1/namespaces/demo/prometheuses/prometheus
  uid: ef59e6e6-e8c2-11e8-8e44-08002771fd7b
spec:
  resources:
    requests:
      memory: 400Mi
  serviceAccountName: prometheus
  serviceMonitorSelector:
    matchLabels:
      app: kubedb
  version: v1.7.0
In this tutorial, the required label is app: kubedb.
Monitor Redis with CoreOS Prometheus
KubeDB implements a Redis CRD to define the specification of a Redis database. Below is the Redis object created in this tutorial.
apiVersion: kubedb.com/v1alpha1
kind: Redis
metadata:
  name: redis-mon-coreos
  namespace: demo
spec:
  version: "4.0-v1"
  storage:
    storageClassName: "standard"
    accessModes:
    - ReadWriteOnce
    resources:
      requests:
        storage: 50Mi
  monitor:
    agent: prometheus.io/coreos-operator
    prometheus:
      namespace: demo
      labels:
        app: kubedb
      interval: 10s
The Redis CRD object contains monitor field in it’s spec. It is also possible to add CoreOS-Prometheus monitor to an existing Redis database by adding the below part in it’s spec field.
Here, spec.monitor.prometheus.labels is the serviceMonitorSelector that we found earlier.
spec:
  monitor:
    agent: prometheus.io/coreos-operator
    prometheus:
      namespace: demo
      labels:
        app: kubedb
      interval: 10s
| Keys | Value | Description |
|---|---|---|
spec.monitor.agent | string | Required. Indicates the monitoring agent used. Only valid value currently is coreos-prometheus-operator |
spec.monitor.prometheus.namespace | string | Required. Indicates namespace where service monitors are created. This must be the same namespace of the Prometheus instance. |
spec.monitor.prometheus.labels | map | Required. Indicates labels applied to service monitor. |
spec.monitor.prometheus.interval | string | Optional. Indicates the scrape interval for database exporter endpoint (eg, ’10s') |
spec.monitor.prometheus.port | int | Optional. Indicates the port for database exporter endpoint (default is 56790) |
Known Limitations: If the database password is updated, exporter must be restarted to use the new credentials. This issue is tracked here.
Run the following command to deploy the above Redis CRD object.
$ kubedb create -f https://raw.githubusercontent.com/kubedb/cli/0.9.0-rc.2/docs/examples/redis/monitoring/coreos-operator/demo-1.yaml
redis.kubedb.com/redis-mon-coreos created
Here,
spec.monitorspecifies that CoreOS Prometheus operator is used to monitor this database instance. A ServiceMonitor should be created in thedemonamespace with labelapp=kubedb. The exporter endpoint should be scrapped every 10 seconds.
KubeDB will create a separate stats service with name <redis-crd-name>-stats for monitoring purpose. KubeDB operator will configure this monitoring service once the Redis is successfully running.
$ kubedb get rd -n demo
NAME               VERSION   STATUS     AGE
redis-mon-coreos   4.0-v1    Creating   24s

$ kubedb describe rd -n demo redis-mon-coreos
Name:               redis-mon-coreos
Namespace:          demo
CreationTimestamp:  Mon, 01 Oct 2018 13:05:15 +0600
Labels:             <none>
Annotations:        <none>
Replicas:           1  total
Status:             Running
  StorageType:      Durable
Volume:
  StorageClass:  standard
  Capacity:      50Mi
  Access Modes:  RWO

StatefulSet:
  Name:               redis-mon-coreos
  CreationTimestamp:  Mon, 01 Oct 2018 13:05:18 +0600
  Labels:               kubedb.com/kind=Redis
                        kubedb.com/name=redis-mon-coreos
  Annotations:        <none>
  Replicas:           824637984636 desired | 1 total
  Pods Status:        1 Running / 0 Waiting / 0 Succeeded / 0 Failed

Service:
  Name:         redis-mon-coreos
  Labels:         kubedb.com/kind=Redis
                  kubedb.com/name=redis-mon-coreos
  Annotations:  <none>
  Type:         ClusterIP
  IP:           10.106.208.162
  Port:         db  6379/TCP
  TargetPort:   db/TCP
  Endpoints:    172.17.0.6:6379

Service:
  Name:         redis-mon-coreos-stats
  Labels:         kubedb.com/kind=Redis
                  kubedb.com/name=redis-mon-coreos
  Annotations:    monitoring.appscode.com/agent=prometheus.io/coreos-operator
  Type:         ClusterIP
  IP:           10.105.233.27
  Port:         prom-http  56790/TCP
  TargetPort:   prom-http/TCP
  Endpoints:    172.17.0.6:56790

Monitoring System:
  Agent:  prometheus.io/coreos-operator
  Prometheus:
    Port:       56790
    Namespace:  demo
    Labels:     app=kubedb
    Interval:   10s

No Snapshots.

Events:
  Type    Reason      Age   From            Message
  ----    ------      ----  ----            -------
  Normal  Successful  42s   Redis operator  Successfully created Service
  Normal  Successful  9s    Redis operator  Successfully created StatefulSet
  Normal  Successful  9s    Redis operator  Successfully created Redis
  Normal  Successful  7s    Redis operator  Successfully created stats service
  Normal  Successful  5s    Redis operator  Successfully patched StatefulSet
  Normal  Successful  5s    Redis operator  Successfully patched Redis
Since spec.monitoring was configured, a ServiceMonitor object is created accordingly. You can verify it running the following commands:
$ kubectl get servicemonitor -n demo
NAME                           AGE
kubedb-demo-redis-mon-coreos   25s

$ kubectl get servicemonitor -n demo kubedb-demo-redis-mon-coreos -o yaml
apiVersion: monitoring.coreos.com/v1
kind: ServiceMonitor
metadata:
  creationTimestamp: 2018-10-01T07:05:54Z
  generation: 1
  labels:
    app: kubedb
    monitoring.appscode.com/service: redis-mon-coreos-stats.demo
  name: kubedb-demo-redis-mon-coreos
  namespace: demo
  resourceVersion: "12902"
  selfLink: /apis/monitoring.coreos.com/v1/namespaces/demo/servicemonitors/kubedb-demo-redis-mon-coreos
  uid: 70100729-c548-11e8-9ba7-0800274bef12
spec:
  endpoints:
  - interval: 10s
    path: /metrics
    port: prom-http
    targetPort: 0
  namespaceSelector:
    matchNames:
    - demo
  selector:
    matchLabels:
      kubedb.com/kind: Redis
      kubedb.com/name: redis-mon-coreos
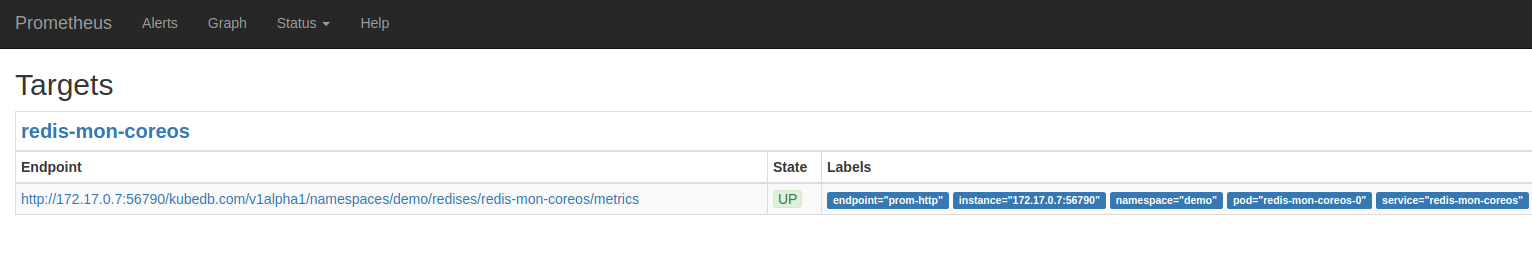
Now, if you go the Prometheus Dashboard, you should see that this database endpoint as one of the targets.
Cleaning up
To cleanup the Kubernetes resources created by this tutorial, run:
kubectl patch -n demo rd/redis-mon-coreos -p '{"spec":{"terminationPolicy":"WipeOut"}}' --type="merge"
kubectl delete -n demo rd/redis-mon-coreos

kubectl patch -n demo drmn/redis-mon-coreos -p '{"spec":{"wipeOut":true}}' --type="merge"
kubectl delete -n demo drmn/redis-mon-coreos

kubectl delete -f https://raw.githubusercontent.com/kubedb/cli/0.9.0-rc.2/docs/examples/monitoring/coreos-operator/demo-1.yaml
kubectl delete -f https://raw.githubusercontent.com/kubedb/cli/0.9.0-rc.2/docs/examples/monitoring/coreos-operator/demo-0.yaml

kubectl delete ns demo
Next Steps
- Monitor your Redis database with KubeDB using out-of-the-box builtin-Prometheus.
- Detail concepts of RedisVersion object.
- Detail concepts of Redis object.
- Use private Docker registry to deploy Redis with KubeDB.
- Want to hack on KubeDB? Check our contribution guidelines.