


You are looking at the documentation of a prior release. To read the documentation of the latest release, please
visit here.
New to KubeDB? Please start here.
Using Prometheus with KubeDB
This tutorial will show you how to monitor PostgreSQL database using Prometheus.
Before You Begin
At first, you need to have a Kubernetes cluster, and the kubectl command-line tool must be configured to communicate with your cluster. If you do not already have a cluster, you can create one by using minikube.
Now, install KubeDB cli on your workstation and KubeDB operator in your cluster following the steps here.
To keep things isolated, this tutorial uses a separate namespace called demo throughout this tutorial.
$ kubectl create ns demo
namespace "demo" created

$ kubectl get ns demo
NAME    STATUS  AGE
demo    Active  5s
Note: Yaml files used in this tutorial are stored in docs/examples/postgres folder in GitHub repository kubedb/cli.
This tutorial assumes that you are familiar with PostgreSQL concept.
Monitor with builtin Prometheus
Below is the Postgres object created in this tutorial.
apiVersion: kubedb.com/v1alpha1
kind: Postgres
metadata:
  name: builtin-prom-postgres
  namespace: demo
spec:
  version: "9.6-v1"
  storage:
    storageClassName: "standard"
    accessModes:
    - ReadWriteOnce
    resources:
      requests:
        storage: 50Mi
  monitor:
    agent: prometheus.io/builtin
Here,
spec.monitorspecifies that built-in prometheus is used to monitor this database instance.
Run following command to create example above.
$ kubectl create -f https://raw.githubusercontent.com/kubedb/cli/0.9.0/docs/examples/postgres/monitoring/builtin-prom-postgres.yaml
postgres.kubedb.com/builtin-prom-postgres created
KubeDB operator will configure its service once the PostgreSQL is successfully running.
$ kubedb get pg -n demo builtin-prom-postgres
NAME                    VERSION   STATUS    AGE
builtin-prom-postgres   9.6-v1    Running   1m
KubeDB will create a separate stats service with name {Postgres name}-stats for monitoring purpose.
$ kubectl get svc -n demo
NAME                             TYPE        CLUSTER-IP       EXTERNAL-IP   PORT(S)     AGE
builtin-prom-postgres            ClusterIP   10.101.93.0      <none>        5432/TCP    1m
builtin-prom-postgres-replicas   ClusterIP   10.105.183.227   <none>        5432/TCP    1m
builtin-prom-postgres-stats      ClusterIP   10.107.173.32    <none>        56790/TCP   46s
kubedb                           ClusterIP   None             <none>        <none>      1h
Let’s describe Service builtin-prom-postgres-stats
$ kubedb describe svc -n demo builtin-prom-postgres-stats
Name:         builtin-prom-postgres-stats
Namespace:    demo
Labels:       kubedb.com/kind=Postgres
              kubedb.com/name=builtin-prom-postgres
Annotations:  monitoring.appscode.com/agent=prometheus.io/builtin
              prometheus.io/path=/metrics
              prometheus.io/port=56790
              prometheus.io/scrape=true
API Version:  v1
Kind:         Service
Metadata:
  Creation Timestamp:  2018-09-24T11:56:38Z
  Owner References:
    API Version:           kubedb.com/v1alpha1
    Block Owner Deletion:  false
    Kind:                  Postgres
    Name:                  builtin-prom-postgres
    UID:                   c077d83a-bff0-11e8-ad46-e6638755530c
  Resource Version:        47773
  Self Link:               /api/v1/namespaces/demo/services/builtin-prom-postgres-stats
  UID:                     e4f47ef9-bff0-11e8-ad46-e6638755530c
Spec:
  Cluster IP:  10.107.173.32
  Ports:
    Name:         prom-http
    Port:         56790
    Protocol:     TCP
    Target Port:  prom-http
  Selector:
    Kubedb . Com / Kind:  Postgres
    Kubedb . Com / Name:  builtin-prom-postgres
  Session Affinity:       None
  Type:                   ClusterIP
Status:
  Load Balancer:
Events:  <none>
You can see that the service contains following annotations.
prometheus.io/path=/metrics
prometheus.io/port=56790
prometheus.io/scrape=true
The prometheus server will discover the service endpoint using these specifications and will scrape metrics from exporter.
Deploy and configure Prometheus Server
The prometheus server is needed to configure so that it can discover endpoints of services. If a Prometheus server is already running in cluster and if it is configured in a way that it can discover service endpoints, no extra configuration will be needed.
If there is no existing Prometheus server running, rest of this tutorial will create a Prometheus server with appropriate configuration.
The configuration file of Prometheus server will be provided by ConfigMap. Create following ConfigMap with Prometheus configuration.
apiVersion: v1
kind: ConfigMap
metadata:
  name: prometheus-server-conf
  labels:
    name: prometheus-server-conf
  namespace: demo
data:
  prometheus.yml: |-
    global:
      scrape_interval: 5s
      evaluation_interval: 5s
    scrape_configs:
    - job_name: 'kubernetes-service-endpoints'

      kubernetes_sd_configs:
      - role: endpoints

      relabel_configs:
      - source_labels: [__meta_kubernetes_service_annotation_prometheus_io_scrape]
        action: keep
        regex: true
      - source_labels: [__meta_kubernetes_service_annotation_prometheus_io_scheme]
        action: replace
        target_label: __scheme__
        regex: (https?)
      - source_labels: [__meta_kubernetes_service_annotation_prometheus_io_path]
        action: replace
        target_label: __metrics_path__
        regex: (.+)
      - source_labels: [__address__, __meta_kubernetes_service_annotation_prometheus_io_port]
        action: replace
        target_label: __address__
        regex: ([^:]+)(?::\d+)?;(\d+)
        replacement: $1:$2
      - action: labelmap
        regex: __meta_kubernetes_service_label_(.+)
      - source_labels: [__meta_kubernetes_namespace]
        action: replace
        target_label: kubernetes_namespace
      - source_labels: [__meta_kubernetes_service_name]
        action: replace
        target_label: kubernetes_name
Create above ConfigMap
$ kubectl create -f https://raw.githubusercontent.com/kubedb/cli/0.9.0/docs/examples/monitoring/builtin-prometheus/demo-1.yaml
configmap/prometheus-server-conf created
Now, the below YAML is used to deploy Prometheus in kubernetes :
apiVersion: apps/v1
kind: Deployment
metadata:
  name: prometheus-server
  namespace: demo
spec:
  replicas: 1
  selector:
    matchLabels:
      app: prometheus-server
  template:
    metadata:
      labels:
        app: prometheus-server
    spec:
      containers:
        - name: prometheus
          image: prom/prometheus:v2.1.0
          args:
            - "--config.file=/etc/prometheus/prometheus.yml"
            - "--storage.tsdb.path=/prometheus/"
          ports:
            - containerPort: 9090
          volumeMounts:
            - name: prometheus-config-volume
              mountPath: /etc/prometheus/
            - name: prometheus-storage-volume
              mountPath: /prometheus/
      volumes:
        - name: prometheus-config-volume
          configMap:
            defaultMode: 420
            name: prometheus-server-conf
        - name: prometheus-storage-volume
          emptyDir: {}
Run the following command to deploy prometheus-server
$ kubectl create -f https://raw.githubusercontent.com/kubedb/cli/0.9.0/docs/examples/monitoring/builtin-prometheus/demo-2.yaml
clusterrole.rbac.authorization.k8s.io/prometheus-server created
serviceaccount/prometheus-server created
clusterrolebinding.rbac.authorization.k8s.io/prometheus-server created
deployment.apps/prometheus-server created
service/prometheus-service created
Wait until pods of the Deployment is running.
$ kubectl get pods -n demo --selector=app=prometheus-server
NAME                                READY     STATUS    RESTARTS   AGE
prometheus-server-9d7b799fd-8x5wb   1/1       Running   0          1m
And also verify RBAC stuffs
$ kubectl get clusterrole prometheus-server -n demo
NAME                AGE
prometheus-server   1m
$ kubectl get clusterrolebinding prometheus-server -n demo
NAME                AGE
prometheus-server   2m
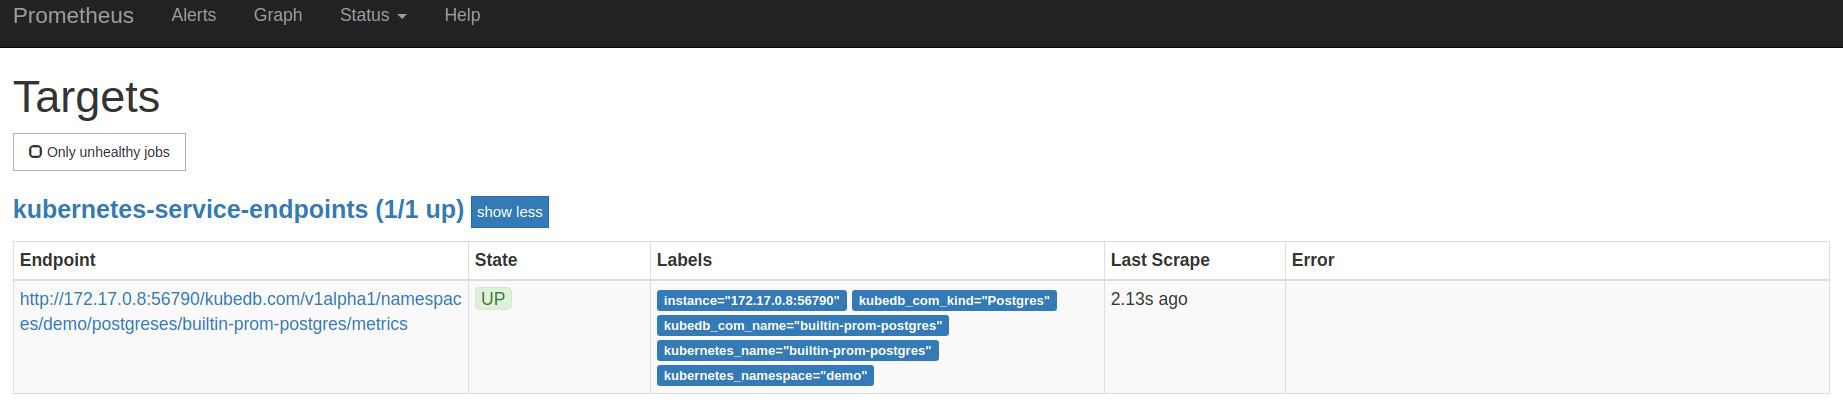
Prometheus Dashboard
Now open prometheus dashboard on browser by running minikube service prometheus-service -n demo.
Or you can get the URL of prometheus-service Service by running following command
$ minikube service prometheus-service -n demo --url
http://192.168.99.100:30901
If you are not using minikube, browse prometheus dashboard using following address http://{Node's ExternalIP}:{NodePort of prometheus-service}.
Now, if you go the Prometheus Dashboard, you should see that this database endpoint as one of the targets.
Cleaning up
To cleanup the Kubernetes resources created by this tutorial, run:
$ kubectl patch -n demo pg/builtin-prom-postgres -p '{"spec":{"terminationPolicy":"WipeOut"}}' --type="merge"
$ kubectl delete -n demo pg/builtin-prom-postgres

$ kubectl delete clusterrole prometheus-server
$ kubectl delete clusterrolebindings  prometheus-server
$ kubectl delete serviceaccounts -n demo  prometheus-server
$ kubectl delete configmap -n demo prometheus-server-conf

$ kubectl delete ns demo
Next Steps
- Monitor your PostgreSQL database with KubeDB using CoreOS Prometheus Operator.
- Want to hack on KubeDB? Check our contribution guidelines.