


You are looking at the documentation of a prior release. To read the documentation of the latest release, please
visit here.
Monitoring KubeDB Operator Using Prometheus operator
Prometheus operator provides simple and Kubernetes native way to deploy and configure Prometheus server. This tutorial will show you how to use Prometheus operator for monitoring KubeDB operator.
Before You Begin
At first, you need to have a Kubernetes cluster, and the kubectl command-line tool must be configured to communicate with your cluster. If you do not already have a cluster, you can create one by using kind.
To keep Prometheus resources isolated, we are going to use a separate namespace called
monitoringto deploy Prometheus operator and respective resources.$ kubectl create ns monitoring namespace/monitoring createdWe need a Prometheus operator instance running. If you don’t already have a running instance, deploy one following the docs from here.
Enable Monitoring in KubeDB operator
Enable Prometheus monitoring using prometheus.io/operator agent while installing KubeDB operator. To know details about how to enable monitoring see here.
Let’s install KubeDB operator with monitoring enabled.
Helm 3:
$ helm install kubedb appscode/kubedb --version v2021.01.26 \
  --namespace kube-system \
  --no-hooks \
  --set monitoring.enabled=true \
  --set monitoring.agent=prometheus.io/operator \
  --set monitoring.prometheus.namespace=monitoring \
  --set monitoring.serviceMonitor.labels.k8s-app=prometheus
Helm 2:
$ helm install appscode/kubedb --name kubedb --version v2021.01.26 \
  --namespace kube-system \
  --set monitoring.enabled=true \
  --set monitoring.agent=prometheus.io/operator \
  --set monitoring.prometheus.namespace=monitoring \
  --set monitoring.serviceMonitor.labels.k8s-app=prometheus
YAML (with Helm 3):
$ helm template kubedb appscode/kubedb --version v2021.01.26 \
  --namespace kube-system \
  --no-hooks \
  --set monitoring.enabled=true \
  --set monitoring.agent=prometheus.io/operator \
  --set monitoring.prometheus.namespace=monitoring \
  --set monitoring.serviceMonitor.labels.k8s-app=prometheus | kubectl apply -f -
This will create a ServiceMonitor crd with name kubedb-servicemonitor in monitoring namespace for monitoring endpoints of kubedb service. This ServiceMonitor will have label k8s-app: prometheus as we have provided it by --servicemonitor-label flag. This label will be used by Prometheus crd to select this ServiceMonitor.
Let’s check the ServiceMonitor crd using following command,
$ kubectl get servicemonitor -n monitoring kubedb-servicemonitor -o yaml
apiVersion: monitoring.coreos.com/v1
kind: ServiceMonitor
metadata:
  creationTimestamp: 2019-01-01T04:21:53Z
  generation: 1
  labels:
    k8s-app: prometheus
  name: kubedb-servicemonitor
  namespace: monitoring
  resourceVersion: "4329"
  selfLink: /apis/monitoring.coreos.com/v1/namespaces/monitoring/servicemonitors/kubedb-servicemonitor
  uid: c4b22d73-0d7c-11e9-9086-080027f411de
spec:
  endpoints:
  - bearerTokenFile: /var/run/secrets/kubernetes.io/serviceaccount/token
    port: api
    scheme: https
    tlsConfig:
      caFile: /etc/prometheus/secrets/kubedb-apiserver-cert/tls.crt
      serverName: kubedb.kube-system.svc
  namespaceSelector:
    matchNames:
    - kube-system
  selector:
    matchLabels:
      app: kubedb
      release: kubedb
KubeDB operator exports kubernetes extension apiserver metrics in TLS secured api endpoint. So, KubeDB has added flowing two section in ServicMonitor specification.
tlsConfigsection to establish TLS secured connection.bearerTokenFileto authorize Prometheus server to KubeDB extension apiserver.
KubeDB has created a secret named kubedb-apiserver-cert in monitoring namespace as we have specified it through --prometheus-namespace. This secret holds the public certificate of KubeDB extension apiserver that has been specified in tlsConfig section.
Verify that the secret kubedb-apiserver-cert has been created in monitoring namespace.
$ kubectl get secret -n monitoring -l=app=kubedb
NAME                             TYPE                DATA   AGE
kubedb-apiserver-cert   kubernetes.io/tls   2      40m
We are going to specify this secret in Prometheus crd specification. Prometheus operator will mount this secret in /etc/prometheus/secret/kubedb-apiserver-cert directory of respective Prometheus server pod.
Here, tlsConfig.caFile indicates the certificate to use for TLS secured connection and tlsConfig.serverName is used to verify hostname for which this certificate is valid.
bearerTokenFile denotes the ServiceAccount token of the Prometheus server that is going to scape metrics from KubeDB operator. Kubernetes automatically mount it in /var/run/secrets/kubernetes.io/serviceaccount/token directory of Prometheus pod. For, an RBAC enabled cluster, we have to grand some permissions to this ServiceAccount.
Configure Prometheus Server
Now, we have to create or configure a Prometheus crd that selects above ServiceMonitor.
Configure Existing Prometheus Server
If you already have a Prometheus crd and respective Prometheus server running, you have to update this Prometheus crd to select kubedb-servicemonitor ServiceMonitor.
At first, add the ServiceMonitor’s label k8s-app: prometheus in spec.serviceMonitorSelector.matchLabels field of Prometheus crd.
serviceMonitorSelector:
  matchLabels:
    k8s-app: prometheus
Then, add secret name kubedb-apiserver-cert in spec.secrets section.
secrets:
  - kubedb-apiserver-cert
Warning: Updating Prometheus crd specification will cause restart of your Prometheus server. If you don’t use a persistent volume for Prometheus storage, you will lost your previously scraped data.
Deploy New Prometheus Server
If you don’t have any existing Prometheus server running, you have to create a Prometheus crd. Prometheus operator will deploy respective Prometheus server automatically.
Create RBAC:
If you are using an RBAC enabled cluster, you have to give necessary RBAC permissions for Prometheus. Let’s create necessary RBAC stuffs for Prometheus,
$ kubectl apply -f https://github.com/appscode/third-party-tools/raw/master/monitoring/prometheus/builtin/artifacts/rbac.yaml
clusterrole.rbac.authorization.k8s.io/prometheus created
serviceaccount/prometheus created
clusterrolebinding.rbac.authorization.k8s.io/prometheus created
YAML for the RBAC resources created above can be found here.
Create Prometheus:
Below is the YAML of Prometheus crd that we are going to create for this tutorial,
apiVersion: monitoring.coreos.com/v1
kind: Prometheus
metadata:
  name: prometheus
  namespace: monitoring # use same namespace as ServiceMonitor crd
  labels:
    prometheus: prometheus
spec:
  replicas: 1
  serviceAccountName: prometheus
  serviceMonitorSelector:
    matchLabels:
      k8s-app: prometheus # change this according to your setup
  secrets:
    - kubedb-apiserver-cert
  resources:
    requests:
      memory: 400Mi
Here, spec.serviceMonitorSelector is used to select the ServiceMonitor crd that is created by KubeDB operator. We have provided kubedb-apiserver-cert secret in spec.secrets field. This will be mounted in Prometheus pod.
Let’s create the Prometheus object we have shown above,
$ kubectl apply -f https://github.com/kubedb/docs/raw/v2021.01.26/docs/examples/monitoring/operator/prometheus.yaml
prometheus.monitoring.coreos.com/prometheus created
Prometheus operator watches for Prometheus crd. Once a Prometheus crd is created, it generates respective configuration and creates a StatefulSet to run Prometheus server.
Let’s check StatefulSet has been created,
$ kubectl get statefulset -n monitoring
NAME                    DESIRED   CURRENT   AGE
prometheus-prometheus   1         1         2m14s
Verify Monitoring Metrics
Prometheus server is listening to port 9090. We are going to use port forwarding to access Prometheus dashboard.
At first, let’s check if the Prometheus pod is in Running state.
$ kubectl get pod prometheus-prometheus-0 -n monitoring
NAME                      READY   STATUS    RESTARTS   AGE
prometheus-prometheus-0   3/3     Running   1          2m40s
Now, run following command on a separate terminal to forward 9090 port of prometheus-prometheus-0 pod,
$ kubectl port-forward -n monitoring prometheus-prometheus-0 9090
Forwarding from 127.0.0.1:9090 -> 9090
Forwarding from [::1]:9090 -> 9090
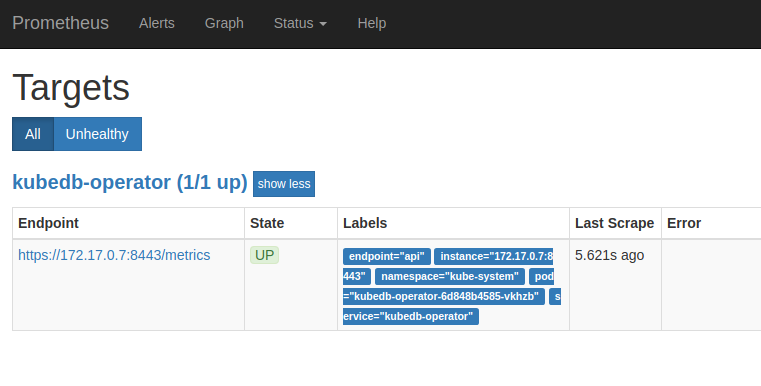
Now, we can access the dashboard at localhost:9090. Open http://localhost:9090 in your browser. You should see api endpoint of kubedb service as target.
Cleanup
To cleanup the Kubernetes resources created by this tutorial, run:
# cleanup Prometheus resources
kubectl delete -n monitoring prometheus prometheus
kubectl delete -n monitoring secret kubedb-apiserver-cert
kubectl delete -n monitoring servicemonitor kubedb-servicemonitor

# delete namespace
kubectl delete ns monitoring
To uninstall KubeDB operator follow this guide.