


You are looking at the documentation of a prior release. To read the documentation of the latest release, please
visit here.
New to KubeDB? Please start here.
X-Pack Monitoring with KubeDB Elasticsearch
This tutorial will show you how to use X-Pack monitoring in an Elasticsearch cluster deployed with KubeDB.
Before You Begin
At first, you need to have a Kubernetes cluster, and the kubectl command-line tool must be configured to communicate with your cluster. If you do not already have a cluster, you can create one by using kind.
Now, install KubeDB cli on your workstation and KubeDB operator in your cluster following the steps here.
As KubeDB uses Search Guard plugin for authentication and authorization, you have to know how to configure Search Guard for both Elasticsearch cluster and Kibana. If you don’t know, please visit here.
To keep things isolated, this tutorial uses a separate namespace called demo throughout this tutorial.
$ kubectl create ns demo
namespace/demo created

$ kubectl get ns demo
NAME    STATUS  AGE
demo    Active  5s
Note: YAML files used in this tutorial are stored in docs/examples/elasticsearch folder in GitHub repository kubedb/docs.
Overview
At first, we will create some necessary Search Guard configuration and roles to give a user permission to monitor an Elasticsearch cluster from Kibana. We will create a secret with this configuration files. Then we will provide this secret in spec.authSecret field of Elasticsearch crd so that our Elasticsearch cluster start with this configuration. We are going to configure Elasticsearch cluster to collect and send x-pack monitoring data over HTTP Exporters using a custom configuration file.
Then, we will deploy Kibana with Search Guard plugin installed. We will configure Kibana to connect with our Elasticsearch cluster and view monitoring data from it.
For this tutorial, we will use Elasticsearch 6.3.0 with Search Guard plugin 23.1 and Kibana 6.3.0 with Search Guard plugin 14 installed.
Deploy Elasticsearch Cluster
Let’s create necessary Search Guard configuration files. Here, we will create two users admin and monitor. User admin will have all permissions on the cluster and user monitor will have some limited permission to view only monitoring data. Here, are the contents of Search Guard configuration files,
sg_action_groups.yml:
###### UNLIMITED ######
UNLIMITED:
  readonly: true
  permissions:
    - "*"

###### CLUSTER LEVEL #####
CLUSTER_MONITOR:
  readonly: true
  permissions:
    - "cluster:monitor/*"

CLUSTER_COMPOSITE_OPS_RO:
  readonly: true
  permissions:
    - "indices:data/read/mget"
    - "indices:data/read/msearch"
    - "indices:data/read/mtv"
    - "indices:data/read/coordinate-msearch*"
    - "indices:admin/aliases/exists*"
    - "indices:admin/aliases/get*"
    - "indices:data/read/scroll"

CLUSTER_COMPOSITE_OPS:
  readonly: true
  permissions:
    - "indices:data/write/bulk"
    - "indices:admin/aliases*"
    - "indices:data/write/reindex"
    - CLUSTER_COMPOSITE_OPS_RO

###### INDEX LEVEL ######
INDICES_ALL:
  readonly: true
  permissions:
    - "indices:*"

READ:
  readonly: true
  permissions:
    - "indices:data/read*"
    - "indices:admin/mappings/fields/get*"
    - "indices:admin/mappings/get*"
sg_roles.yaml:
### Admin
sg_all_access:
  readonly: true
  cluster:
    - UNLIMITED
  indices:
    '*':
      '*':
        - UNLIMITED
  tenants:
    admin_tenant: RW

### X-Pack Monitoring
sg_xp_monitoring:
  cluster:
    - cluster:admin/xpack/monitoring/*
    - cluster:admin/ingest/pipeline/put
    - cluster:admin/ingest/pipeline/get
    - indices:admin/template/get
    - indices:admin/template/put
    - CLUSTER_MONITOR
    - CLUSTER_COMPOSITE_OPS
  indices:
    '?monitor*':
      '*':
        - INDICES_ALL
    '?marvel*':
      '*':
        - INDICES_ALL
    '?kibana*':
      '*':
        - READ
    '*':
      '*':
        - indices:data/read/field_caps
sg_internal_users.yml:
#password is: admin@secret
admin:
  readonly: true
  hash: $2y$12$skma87wuFFtxtGWegeAiIeTtUH1nnOfIRZzwwhBlzXjg0DdM4gLeG
  roles:
    - admin

#password is: monitor@secret
monitor:
  readonly: true
  hash: $2y$12$JDTXih3AqV/1MDRYQ.KIY.u68CkzCIq.xiiqwtRJx3cjN0YmFavTe
  roles:
    - monitor
Here, we have used admin@secret password for admin user and monitor@secret password for monitor user. You can use htpasswd to generate the bcrypt encrypted password hashes.
$htpasswd -bnBC 12 "" <password_here>| tr -d ':\n'
sg_roles_mapping.yml:
sg_all_access:
  readonly: true
  backendroles:
    - admin

sg_xp_monitoring:
  readonly: true
  backendroles:
    - monitor
sg_config.yml:
searchguard:
  dynamic:
    authc:
      kibana_auth_domain:
        enabled: true
        order: 0
        http_authenticator:
          type: basic
          challenge: false
        authentication_backend:
          type: internal
      basic_internal_auth_domain:
        http_enabled: true
        transport_enabled: true
        order: 1
        http_authenticator:
          type: basic
          challenge: true
        authentication_backend:
          type: internal
Now, create a secret with these Search Guard configuration files.
 $ kubectl create secret generic -n demo es-auth \
             --from-literal=ADMIN_USERNAME=admin \
             --from-literal=ADMIN_PASSWORD=admin@secret \
             --from-file=./sg_action_groups.yml \
             --from-file=./sg_config.yml \
             --from-file=./sg_internal_users.yml \
             --from-file=./sg_roles_mapping.yml \
             --from-file=./sg_roles.yml
secret/es-auth created
Verify the secret has desired configuration files,
$ kubectl get secret -n demo es-auth -o yaml
apiVersion: v1
data:
  sg_action_groups.yml: <base64 encoded content>
  sg_config.yml: <base64 encoded content>
  sg_internal_users.yml: <base64 encoded content>
  sg_roles.yml: <base64 encoded content>
  sg_roles_mapping.yml: <base64 encoded content>
kind: Secret
metadata:
  ...
  name: es-auth
  namespace: demo
  ...
type: Opaque
As we are using Search Guard plugin for authentication, we need to ensure that x-pack security is not enabled. We will ensure that by providing xpack.security.enabled: false in common-config.yml file and we will use this file to configure our Elasticsearch cluster. As Search Guard does not support local exporter, we will use http exporter and set host filed to http://127.0.0.1:9200 to store monitoring data in same cluster.
Let’s create common-config.yml with following configuration,
xpack.security.enabled: false
xpack.monitoring.enabled: true
xpack.monitoring.collection.enabled: true
xpack.monitoring.exporters:
  my-http-exporter:
    type: http
    host: ["http://127.0.0.1:9200"]
    auth:
      username: monitor
      password: monitor@secret
Create a ConfigMap using this file,
$ kubectl create configmap -n demo es-custom-config \
                        --from-file=./common-config.yaml
configmap/es-custom-config created
Verify that the ConfigMap has desired configuration,
$  kubectl get configmap -n demo es-custom-config -o yaml
apiVersion: v1
data:
  common-config.yaml: |-
    xpack.security.enabled: false
    xpack.monitoring.enabled: true
    xpack.monitoring.collection.enabled: true
    xpack.monitoring.exporters:
      my-http-exporter:
        type: http
        host: ["http://127.0.0.1:9200"]
        auth:
          username: monitor
          password: monitor@secret
kind: ConfigMap
metadata:
  ...
  name: es-custom-config
  namespace: demo
  ...
Now, create Elasticsearch crd specifying spec.authSecret and spec.configSecret field.
$ kubectl apply -f kubectl apply -f https://github.com/kubedb/docs/raw/v2021.03.17/docs/examples/elasticsearch/x-pack/es-mon-demo.yaml
elasticsearch.kubedb.com/es-mon-demo created
Below is the YAML for the Elasticsearch crd we just created.
apiVersion: kubedb.com/v1alpha2
kind: Elasticsearch
metadata:
  name: es-mon-demo
  namespace: demo
spec:
  version: searchguard-7.9.3
  replicas: 1
  authSecret:
    name: es-auth
  configSecret:
    name: es-custom-config
  storage:
    storageClassName: "standard"
    accessModes:
    - ReadWriteOnce
    resources:
      requests:
        storage: 1Gi
Now, wait for few minutes. KubeDB will create necessary secrets, services, and statefulsets.
Check resources created in demo namespace by KubeDB,
$  kubectl get all -n demo -l=app.kubernetes.io/instance=es-mon-demo
NAME                READY     STATUS    RESTARTS   AGE
pod/es-mon-demo-0   1/1       Running   0          37s

NAME                         TYPE        CLUSTER-IP       EXTERNAL-IP   PORT(S)    AGE
service/es-mon-demo          ClusterIP   10.110.227.143   <none>        9200/TCP   40s
service/es-mon-demo-master   ClusterIP   10.104.12.90     <none>        9300/TCP   40s

NAME                           DESIRED   CURRENT   AGE
statefulset.apps/es-mon-demo   1         1         39s
Once everything is created, Elasticsearch will go to Running state. Check that Elasticsearch is in running state.
$ kubectl get es -n demo es-mon-demo
NAME          VERSION    STATUS    AGE
es-mon-demo   7.3.2   Running   1m
Now, check elasticsearch log to see if the cluster is ready to accept requests,
$ kubectl logs -n demo es-mon-demo-0 -f
...
Starting runit...
...
Elasticsearch Version: 6.3.0
Search Guard Version: 6.3.0-23.0
Connected as CN=sgadmin,O=Elasticsearch Operator
Contacting elasticsearch cluster 'elasticsearch' and wait for YELLOW clusterstate ...
Clustername: es-mon-demo
Clusterstate: GREEN
Number of nodes: 1
Number of data nodes: 1
...
Done with success
...
Once you see Done with success success line in the log, the cluster is ready to accept requests. Now, it is time to connect with Kibana.
Deploy Kibana
In order to view monitoring data from Kibana, we need to configure kibana.yml with appropriate configuration.
KubeDB has created a service with name es-mon-demo in demo namespace for the Elasticsearch cluster. We will use this service in elasticsearch.url field. Kibana will use this service to connect with the Elasticsearch cluster.
Let’s, configure kibana.yml as below,
xpack.security.enabled: false
xpack.monitoring.enabled: true
xpack.monitoring.kibana.collection.enabled: true
xpack.monitoring.ui.enabled: true

server.host: 0.0.0.0

elasticsearch.url: "http://es-mon-demo.demo.svc:9200"
elasticsearch.username: "monitor"
elasticsearch.password: "monitor@secret"

searchguard.auth.type: "basicauth"
searchguard.cookie.secure: false
Notice the elasticsearch.username and elasticsearch.password field. Kibana will connect to Elasticsearch cluster with this credentials. They must match with the credentials we have provided in sg_internal_users.yml file for monitor user while creating the cluster.
Now, create a ConfigMap with kibana.yml file. We will mount this ConfigMap in Kibana deployment so that Kibana starts with this configuration.
$ kubectl create configmap -n demo kibana-config \
                        --from-file=./kibana.yml
configmap/kibana-config created
Finally, deploy Kibana deployment,
$ kubectl apply -f https://github.com/kubedb/docs/raw/v2021.03.17/docs/examples/elasticsearch/kibana/kibana-deployment.yaml
deployment.apps/kibana created
Below is the YAML for the Kibana deployment we just created.
apiVersion: apps/v1
kind: Deployment
metadata:
  name: kibana
  namespace: demo
spec:
  replicas: 1
  selector:
    matchLabels:
      app: kibana
  template:
    metadata:
      labels:
        app: kibana
    spec:
      containers:
      - name: kibana
        image: kubedb/kibana:6.3.0
        volumeMounts:
        - name:  kibana-config
          mountPath: /usr/share/kibana/config
      volumes:
      - name:  kibana-config
        configMap:
          name: kibana-config
Now, wait for few minutes. Let the Kibana pod go inRunning state. Check pod is in Running using this command,
 $ kubectl get pods -n demo -l app=kibana
NAME                      READY     STATUS    RESTARTS   AGE
kibana-84b8cbcf7c-mg699   1/1       Running   0          3m
Now, watch the Kibana pod’s log to see if Kibana is ready to access,
$ kubectl logs -n demo kibana-84b8cbcf7c-mg699 -f
...
{"type":"log","@timestamp":"2018-08-27T09:50:47Z","tags":["listening","info"],"pid":1,"message":"Server running at http://0.0.0.0:5601"}
Once you see "message":"Server running at http://0.0.0.0:5601" in the log, Kibana is ready. Now it is time to access Kibana UI.
Kibana is running on port 5601 in of kibana-84b8cbcf7c-mg699 pod. In order to access Kibana UI from outside of the cluster, we will use port forwarding.
First, open a new terminal and run,
$ kubectl port-forward -n demo kibana-84b8cbcf7c-mg699 5601
Forwarding from 127.0.0.1:5601 -> 5601
Forwarding from [::1]:5601 -> 5601
Now, open localhost:5601 in your browser. When you will open the address, you will be greeted with Search Guard login UI. When you will open the address, you will be greeted with Search Guard login UI.
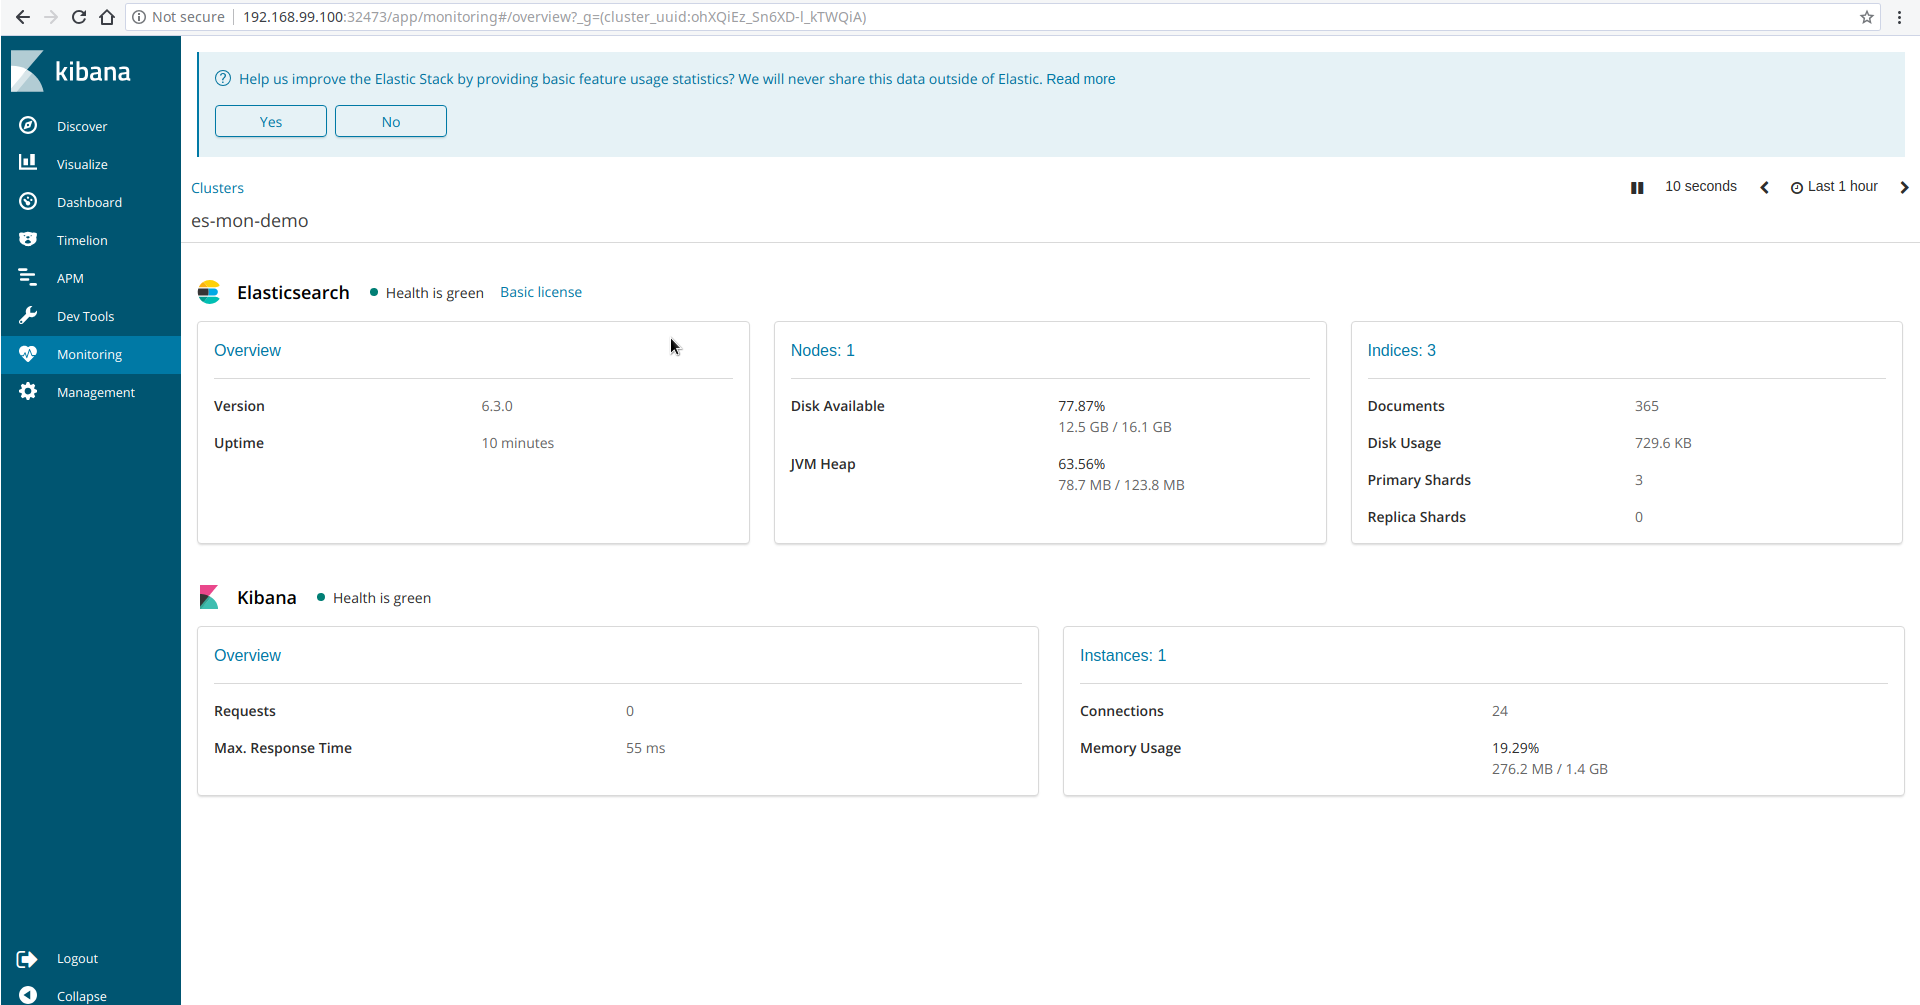
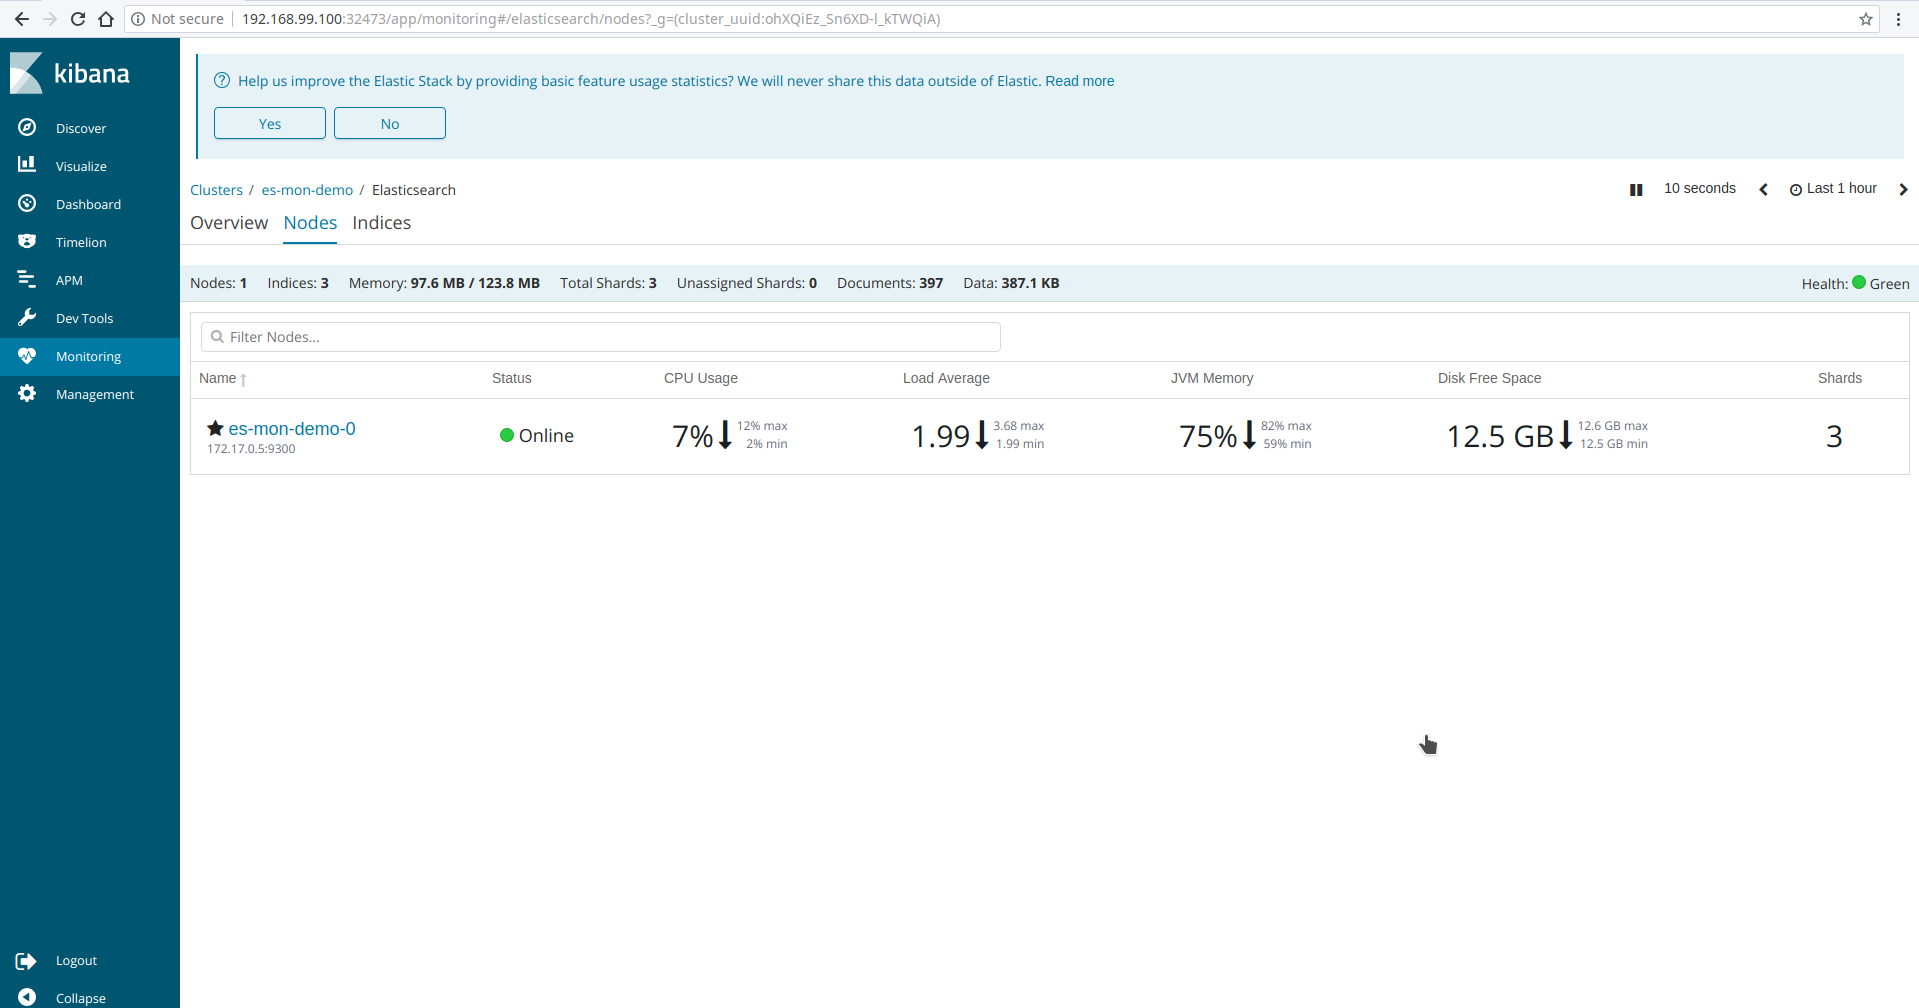
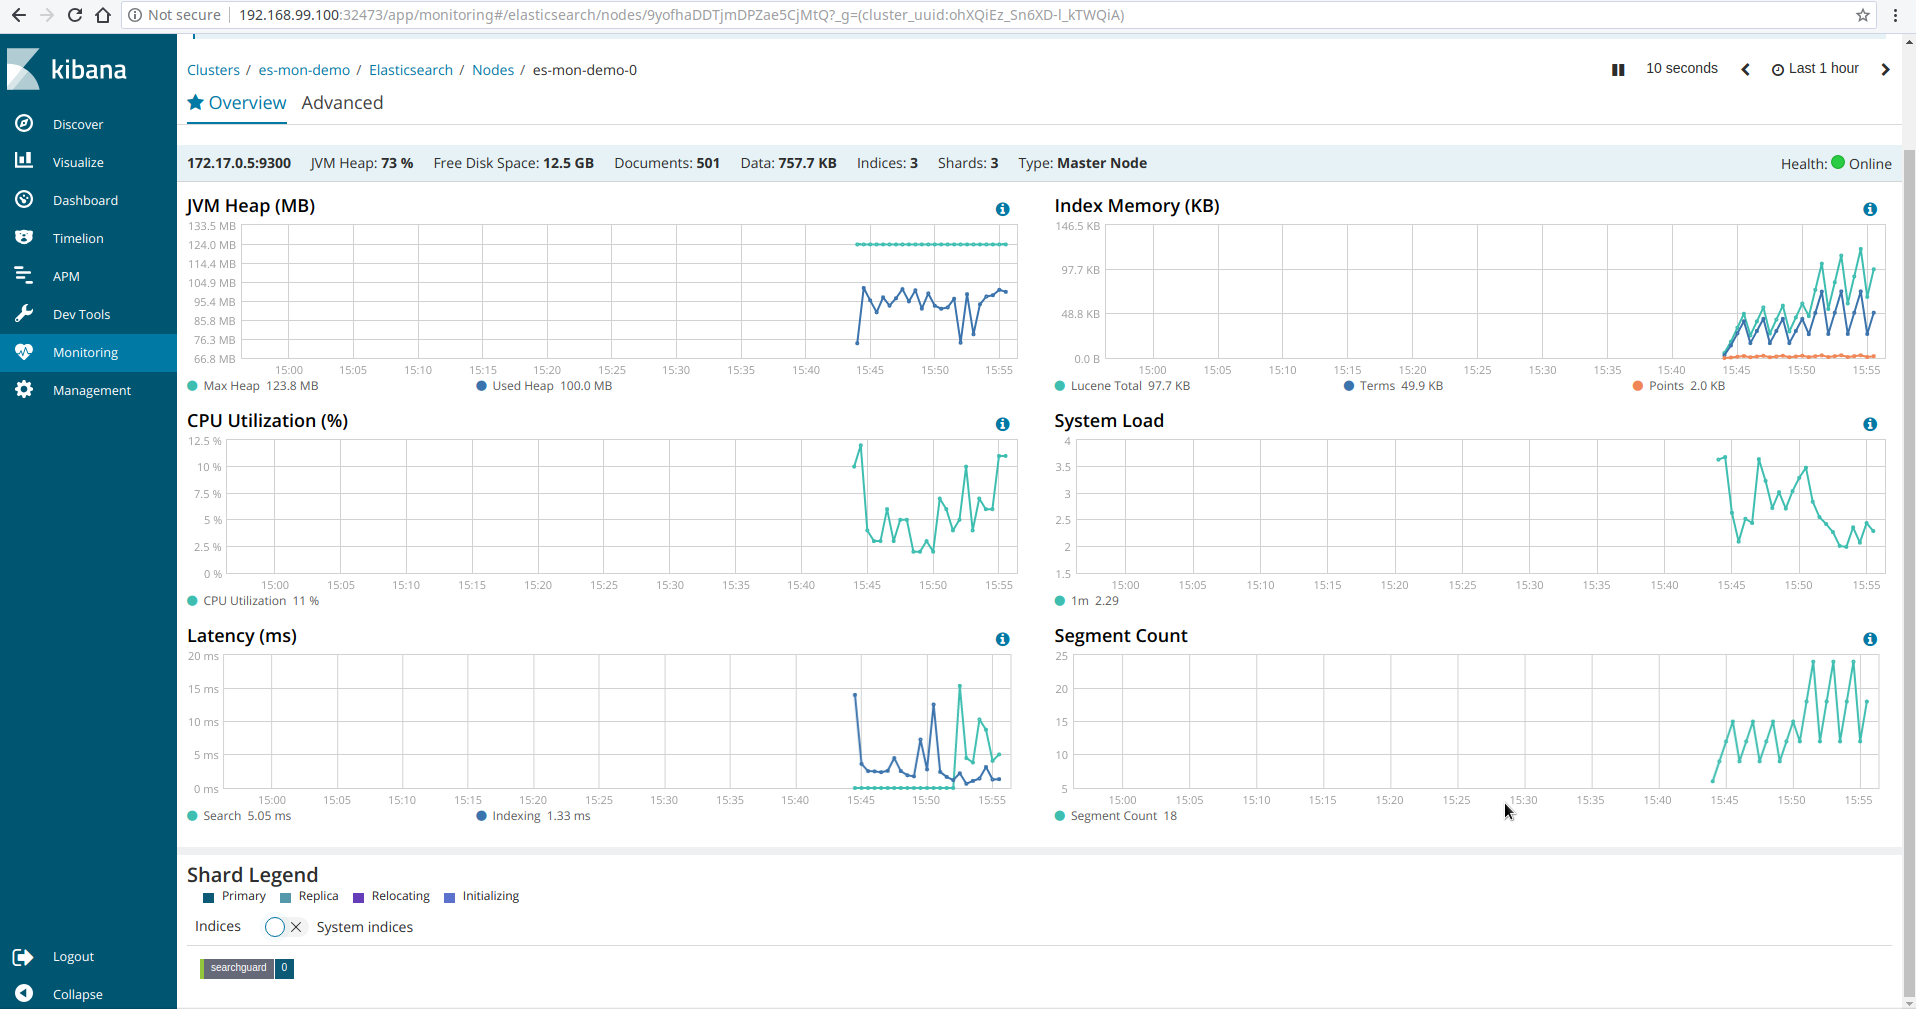
Login with following credentials: username: monitor and password: monitor@secret. After login, go to Monitoring tab in Kibana UI. You will see Kibana has connected with the Elasticsearch cluster and showing monitoring data. Some screenshots of monitoring es-mon-demo cluster is given below.
Monitoring Multiple Cluster
Monitoring multiple cluster is paid feature of X-Pack. If you are interested then follow these steps,
- First, create a separate cluster to store monitoring data. Let’s say it monitoring-cluster.
- Configure monitoring-cluster to connect with Kibana.
- Configure Kibana to view monitoring data from monitoring-cluster.
- Configure
httpexporter of your production clusters to export monitoring data to the monitoring-cluster. Setxpack.monitoring.exporters.<exporter-name>.host:field to the address of the monitoring-cluster.
Now, your production clusters will send monitoring data to the monitoring-cluster and Kibana will retrieve these data from it.
Cleanup
To cleanup the Kubernetes resources created by this tutorial, run:
$ kubectl patch -n demo es/es-mon-demo -p '{"spec":{"terminationPolicy":"WipeOut"}}' --type="merge"

$ kubectl delete -n demo es/es-mon-demo

$ kubectl delete  -n demo configmap/es-custom-config

$ kubectl delete -n demo configmap/kibana-config

$ kubectl delete -n demo deployment/kibana

$ kubectl delete ns demo
To uninstall KubeDB follow this guide.