


You are looking at the documentation of a prior release. To read the documentation of the latest release, please
visit here.
Monitoring KubeDB Operator with builtin Prometheus
This tutorial will show you how to configure builtin Prometheus scraper to monitor KubeDB operator.
Before You Begin
At first, you need to have a Kubernetes cluster, and the kubectl command-line tool must be configured to communicate with your cluster. If you do not already have a cluster, you can create one by using kind.
If you are not familiar with how to configure Prometheus to scrape metrics from various Kubernetes resources, please read the tutorial from here.
To keep Prometheus resources isolated, we are going to use a separate namespace called
monitoringto deploy respective monitoring resources.$ kubectl create ns monitoring namespace/monitoring created
Enable KubeDB Operator Monitoring
Enable Prometheus monitoring using prometheus.io/builtin agent while installing KubeDB. To know details about how to enable monitoring see here.
Let’s install KubeDB with operator monitoring enabled.
Helm 3:
$ helm install kubedb appscode/kubedb --version v2021.04.16 \
  --namespace kube-system \
  --set kubedb-community.monitoring.enabled=true \
  --set kubedb-community.monitoring.agent=prometheus.io/builtin \
  --set kubedb-community.monitoring.prometheus.namespace=monitoring \
  --set kubedb-community.monitoring.serviceMonitor.labels.k8s-app=prometheus
Helm 2:
$ helm install appscode/kubedb --name kubedb --version v2021.04.16 \
  --namespace kube-system \
  --set kubedb-community.monitoring.enabled=true \
  --set kubedb-community.monitoring.agent=prometheus.io/builtin \
  --set kubedb-community.monitoring.prometheus.namespace=monitoring \
  --set kubedb-community.monitoring.serviceMonitor.labels.k8s-app=prometheus
YAML (with Helm 3):
$ helm template kubedb appscode/kubedb --version v2021.04.16 \
  --namespace kube-system \
  --set kubedb-community.monitoring.enabled=true \
  --set kubedb-community.monitoring.agent=prometheus.io/builtin \
  --set kubedb-community.monitoring.prometheus.namespace=monitoring \
  --set kubedb-community.monitoring.serviceMonitor.labels.k8s-app=prometheus | kubectl apply -f -
This will add necessary annotations to kubedb service created in kube-system namespace. Prometheus server will scrape metrics using those annotations. Let’s check which annotations are added to the service,
$ kubectl get service -n kube-system kubedb -o yaml
apiVersion: v1
kind: Service
metadata:
  annotations:
    kubectl.kubernetes.io/last-applied-configuration: |
      {"apiVersion":"v1","kind":"Service","metadata":{"annotations":{},"labels":{"app":"kubedb"},"name":"kubedb","namespace":"kube-system"},"spec":{"ports":[{"name":"api","port":443,"targetPort":8443}],"selector":{"app":"kubedb"}}}
    prometheus.io/path: /metrics
    prometheus.io/port: "8443"
    prometheus.io/scheme: https
    prometheus.io/scrape: "true"
  creationTimestamp: 2018-12-31T08:44:05Z
  labels:
    app: kubedb
  name: kubedb
  namespace: kube-system
  resourceVersion: "22287"
  selfLink: /api/v1/namespaces/kube-system/services/kubedb
  uid: 3af092c3-0cd8-11e9-9662-080027e8eafe
spec:
  clusterIP: 10.108.131.64
  ports:
  - name: api
    port: 443
    protocol: TCP
    targetPort: 8443
  selector:
    app: kubedb
  sessionAffinity: None
  type: ClusterIP
status:
  loadBalancer: {}
Here, prometheus.io/scrape: "true" annotation indicates that Prometheus should scrape metrics for this service.
The following three annotations point to api endpoints which provides operator metrics.
prometheus.io/path: /metrics
prometheus.io/port: "8443"
prometheus.io/scheme: https
Now, we are ready to configure our Prometheus server to scrape those metrics.
Configure Prometheus Server
Now, we have to configure a Prometheus scraping job to scrape the metrics using this service. We are going to configure scraping job similar to this kubernetes-service-endpoints job. However, as we are going to collect metrics from a TLS secured endpoint that exports kubernetes extension apiserver metrics, we have to add following configurations:
- tls_config section to establish TLS secured connection.
bearer_token_fileto authorize Prometheus server to KubeDB extension apiserver.
KubeDB has created a secret named kubedb-apiserver-cert in monitoring namespace as we have specified it through --prometheus-namespace. This secret holds the public certificate of KubeDB extension apiserver that is necessary to configure tls_config section.
Verify that the secret kubedb-apiserver-cert has been created in monitoring namespace.
$ kubectl get secret -n monitoring -l=app=kubedb
NAME                             TYPE                DATA   AGE
kubedb-apiserver-cert   kubernetes.io/tls   2      3h33m
We are going to mount this secret in /etc/prometheus/secret/kubedb-apiserver-cert directory of Prometheus deployment.
Let’s configure a Prometheus scraping job to collect the operator metrics.
- job_name: kubedb
  kubernetes_sd_configs:
  - role: endpoints
  # we have to provide certificate to establish tls secure connection
  tls_config:
    # public certificate of the extension apiserver that has been mounted in "/etc/prometheus/secret/<tls secret name>" directory of prometheus server
    ca_file: /etc/prometheus/secret/kubedb-apiserver-cert/tls.crt
    # dns name for which the certificate is valid
    server_name: kubedb.kube-system.svc
  # bearer_token_file is required for authorizing prometheus server to extension apiserver
  bearer_token_file: /var/run/secrets/kubernetes.io/serviceaccount/token
  # by default Prometheus server select all kubernetes services as possible target.
  # relabel_config is used to filter only desired endpoints
  relabel_configs:
  # keep only those services that has "prometheus.io/scrape: true" anootation.
  - source_labels: [__meta_kubernetes_service_annotation_prometheus_io_scrape]
    regex: true
    action: keep
  # keep only those services that has "app: kubedb" label
  - source_labels: [__meta_kubernetes_service_label_app]
    regex: kubedb
    action: keep
  # keep only those services that has endpoint named "api"
  - source_labels: [__meta_kubernetes_endpoint_port_name]
    regex: api
    action: keep
  # read the metric path from "prometheus.io/path: <path>" annotation
  - source_labels: [__meta_kubernetes_service_annotation_prometheus_io_path]
    regex: (.+)
    target_label: __metrics_path__
    action: replace
  # read the scraping scheme from "prometheus.io/scheme: <scheme>" annotation
  - source_labels: [__meta_kubernetes_service_annotation_prometheus_io_scheme]
    action: replace
    target_label: __scheme__
    regex: (https?)
  # read the port from "prometheus.io/port: <port>" annotation and update scraping address accordingly
  - source_labels: [__address__, __meta_kubernetes_service_annotation_prometheus_io_port]
    action: replace
    target_label: __address__
    regex: ([^:]+)(?::\d+)?;(\d+)
    replacement: $1:$2
  # add service namespace as label to the scraped metrics
  - source_labels: [__meta_kubernetes_namespace]
    separator: ;
    regex: (.*)
    target_label: namespace
    replacement: $1
    action: replace
  # add service name as label to the scraped metrics
  - source_labels: [__meta_kubernetes_service_name]
    separator: ;
    regex: (.*)
    target_label: service
    replacement: $1
    action: replace
Note that, bearer_token_file denotes the ServiceAccount token of the Prometheus server. Kubernetes automatically mount it in /var/run/secrets/kubernetes.io/serviceaccount/token directory of Prometheus pod. For, an RBAC enabled cluster, we have to grand some permissions to this ServiceAccount.
Configure Existing Prometheus Server
If you already have a Prometheus server running, update the respective ConfigMap and add above scraping job.
Then, you have to mount kubedb-apiserver-cert secret in Prometheus deployment. Add the secret as volume:
volumes:
- name: kubedb-apiserver-cert
  secret:
    defaultMode: 420
    name: kubedb-apiserver-cert
    items: # avoid mounting private key
    - key: tls.crt
      path: tls.crt
Then, mount this volume in /etc/prometheus/secret/kubedb-apiserver-cert directory.
volumeMounts:
- name: kubedb-apiserver-cert # mount the secret volume with public certificate of the kubedb extension apiserver
  mountPath: /etc/prometheus/secret/kubedb-apiserver-cert
Warning: Updating deployment will cause restart of your Prometheus server. If you don’t use a persistent volume for Prometheus storage, you will lose your previously scraped data.
Deploy New Prometheus Server
If you don’t have any existing Prometheus server running, you have to deploy one. In this section, we are going to deploy a Prometheus server to collect metrics from KubeDB operator.
Create ConfigMap:
At first, create a ConfigMap with the scraping configuration. Bellow, the YAML of ConfigMap that we are going to create in this tutorial.
apiVersion: v1
kind: ConfigMap
metadata:
  name: kubedb-prom-config
  labels:
    app: kubedb
  namespace: monitoring
data:
  prometheus.yml: |-
    global:
      scrape_interval: 30s
      scrape_timeout: 10s
      evaluation_interval: 30s
    scrape_configs:
    - job_name: kubedb
      kubernetes_sd_configs:
      - role: endpoints
      # we have to provide certificate to establish tls secure connection
      tls_config:
        # public certificate of the extension apiserver that has been mounted in "/etc/prometheus/secret/<tls secret name>" directory of prometheus server
        ca_file: /etc/prometheus/secret/kubedb-apiserver-cert/tls.crt
        # dns name for which the certificate is valid
        server_name: kubedb.kube-system.svc
      # bearer_token_file is required for authorizing prometheus server to extension apiserver
      bearer_token_file: /var/run/secrets/kubernetes.io/serviceaccount/token
      # by default Prometheus server select all kubernetes services as possible target.
      # relabel_config is used to filter only desired endpoints
      relabel_configs:
      # keep only those services that has "prometheus.io/scrape: true" anootation.
      - source_labels: [__meta_kubernetes_service_annotation_prometheus_io_scrape]
        regex: true
        action: keep
      # keep only those services that has "app: kubedb" label
      - source_labels: [__meta_kubernetes_service_label_app]
        regex: kubedb
        action: keep
      # keep only those services that has endpoint named "api"
      - source_labels: [__meta_kubernetes_endpoint_port_name]
        regex: api
        action: keep
      # read the metric path from "prometheus.io/path: <path>" annotation
      - source_labels: [__meta_kubernetes_service_annotation_prometheus_io_path]
        regex: (.+)
        target_label: __metrics_path__
        action: replace
      # read the scraping scheme from "prometheus.io/scheme: <scheme>" annotation
      - source_labels: [__meta_kubernetes_service_annotation_prometheus_io_scheme]
        action: replace
        target_label: __scheme__
        regex: (https?)
      # read the port from "prometheus.io/port: <port>" annotation and update scraping address accordingly
      - source_labels: [__address__, __meta_kubernetes_service_annotation_prometheus_io_port]
        action: replace
        target_label: __address__
        regex: ([^:]+)(?::\d+)?;(\d+)
        replacement: $1:$2
      # add service namespace as label to the scraped metrics
      - source_labels: [__meta_kubernetes_namespace]
        separator: ;
        regex: (.*)
        target_label: namespace
        replacement: $1
        action: replace
      # add service name as label to the scraped metrics
      - source_labels: [__meta_kubernetes_service_name]
        separator: ;
        regex: (.*)
        target_label: service
        replacement: $1
        action: replace
Let’s create the ConfigMap we have shown above,
$ kubectl apply -f https://github.com/kubedb/docs/raw/v2021.04.16/docs/examples/monitoring/operator/prom-config.yaml
configmap/kubedb-prom-config created
Create RBAC:
If you are using an RBAC enabled cluster, you have to give necessary RBAC permissions for Prometheus. Let’s create necessary RBAC stuffs for Prometheus,
$ kubectl apply -f https://github.com/appscode/third-party-tools/raw/master/monitoring/prometheus/builtin/artifacts/rbac.yaml
clusterrole.rbac.authorization.k8s.io/prometheus created
serviceaccount/prometheus created
clusterrolebinding.rbac.authorization.k8s.io/prometheus created
YAML for the RBAC resources created above can be found here.
Deploy Prometheus:
Now, we are ready to deploy Prometheus server. YAML for the deployment that we are going to create for Prometheus is shown below.
apiVersion: apps/v1
kind: Deployment
metadata:
  name: prometheus
  namespace: monitoring
spec:
  replicas: 1
  selector:
    matchLabels:
      app: prometheus
  template:
    metadata:
      labels:
        app: prometheus
    spec:
      serviceAccountName: prometheus
      containers:
      - name: prometheus
        image: prom/prometheus:v2.4.3
        args:
        - "--config.file=/etc/prometheus/prometheus.yml"
        - "--storage.tsdb.path=/prometheus/"
        ports:
        - containerPort: 9090
        volumeMounts:
        - name: prometheus-config-volume
          mountPath: /etc/prometheus/
        - name: prometheus-storage-volume
          mountPath: /prometheus/
        - name: kubedb-apiserver-cert # mount the secret volume with public certificate of the kubedb extension apiserver
          mountPath: /etc/prometheus/secret/kubedb-apiserver-cert
      volumes:
      - name: prometheus-config-volume
        configMap:
          defaultMode: 420
          name: kubedb-prom-conf
      - name: prometheus-storage-volume
        emptyDir: {}
      - name: kubedb-apiserver-cert
        secret:
          defaultMode: 420
          secretName: kubedb-apiserver-cert
          items: # avoid mounting private key
          - key: tls.crt
            path: tls.crt
Notice that, we have mounted kubedb-apiserver-cert secret as a volume at /etc/prometheus/secret/kubedb-apiserver-cert directory.
Use a persistent volume instead of
emptyDirforprometheus-storagevolume if you don’t want to lose collected metrics on Prometheus pod restart.
Now, let’s create the deployment,
$ kubectl apply -f https://github.com/kubedb/docs/raw/v2021.04.16/docs/examples/monitoring/operator/prom-deploy.yaml
deployment.apps/prometheus created
Verify Monitoring Metrics
Prometheus server is listening to port 9090. We are going to use port forwarding to access Prometheus dashboard.
At first, let’s check if the Prometheus pod is in Running state.
$ kubectl get pod -n monitoring -l=app=prometheus
NAME                         READY   STATUS    RESTARTS   AGE
prometheus-5bcb9678c-kh8vt   1/1     Running   0          149m
Now, run following command on a separate terminal to forward 9090 port of prometheus-5bcb9678c-kh8vt pod,
$ kubectl port-forward -n monitoring prometheus-5bcb9678c-kh8vt 9090
Forwarding from 127.0.0.1:9090 -> 9090
Forwarding from [::1]:9090 -> 9090
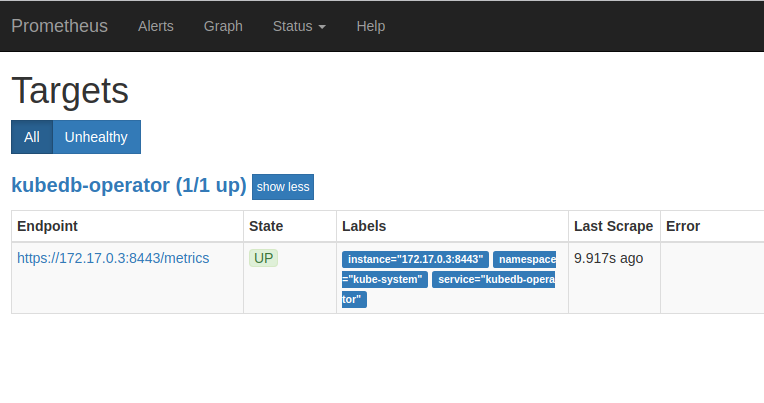
Now, we can access the dashboard at localhost:9090. Open http://localhost:9090 in your browser. You should see api endpoint of kubedb service as target.
Cleanup
To cleanup the Kubernetes resources created by this tutorial, run:
kubectl delete clusterrole -l=app=prometheus-demo
kubectl delete clusterrolebinding -l=app=prometheus-demo

kubectl delete -n monitoring deployment prometheus
kubectl delete -n monitoring serviceaccount/prometheus
kubectl delete -n monitoring configmap/kubedb-prom-config
kubectl delete -n monitoring secret kubedb-apiserver-cert

kubectl delete ns monitoring
To uninstall KubeDB follow this guide.