You are looking at the documentation of a prior release. To read the documentation of the latest release, please
visit here.
New to KubeDB? Please start here.
Visualize PgBouncer Using Grafana Dashboard
Grafana is an open source, feature rich metrics dashboard and graph editor for Graphite, Elasticsearch, OpenTSDB, Prometheus and InfluxDB. PgBouncer comes with a Grafana dashboard designed to monitor real-time updates of PgBouncer servers using Prometheus metrics.
This tutorial will show you how to import our dashboard on Grafana to monitor PgBouncer deployed with KubeDB.
Before You Begin
At first, you need to have a Kubernetes cluster, and the kubectl command-line tool must be configured to communicate with your cluster. If you do not already have a cluster, you can create one by using kind.
To learn how Prometheus monitoring works with KubeDB in general, please visit here.
You need to have monitoring enabled using either Builtin Prometheus or Prometheus operator.
To keep everything isolated, we are going to use a separate namespace called
monitoringto deploy respective monitoring resources. We are going to deploy database indemonamespace.$ kubectl create ns monitoring namespace/monitoring created $ kubectl create ns demo namespace/demo created
Note: YAML files used in this tutorial are stored in docs/examples/pgbouncer folder in GitHub repository kubedb/docs.
Deploy Grafana
After you have made sure that you have a PgBouncer server running with Monitoring enabled, you’re ready to deploy your very own Grafana server. If you still have not deployed PgBouncer server with monitoring enabled, then do so using Builtin Prometheus or Prometheus operator.
However, if you already have a Grafana server running in your cluster, feel free to skip this part. Otherwise, create one using:
$ kubectl apply -f https://github.com/kubedb/docs/raw/v2023.12.21/docs/examples/pgbouncer/monitoring/grafana.yaml
deployment.apps/grafana created
Let’s get the name of the pod created by this deployment:
$ kubectl get pod -n monitoring -l "app=grafana"

NAME                       READY   STATUS    RESTARTS   AGE
grafana-7cbd6b6f87-w9dkh   1/1     Running   0          57s
View Dashboard
Now, we have to expose the Grafana pod so that we can access it from a browser.
$ kubectl port-forward -n monitoring grafana-7cbd6b6f87-w9dkh 3000
Forwarding from 127.0.0.1:3000 -> 3000
Forwarding from [::1]:3000 -> 3000
Grafana should now be available on localhost. Use default credentials (username: admin, password: admin) to login to Grafana Dashboard.
Add Data Source
First, we need to know the name of the service that exposes our prometheus server pods. In this tutorial, we have used a service named prometheus-operated that exposes our prometheus metrics on port 9090.
$ kubectl get service -n monitoring
NAME                  TYPE        CLUSTER-IP       EXTERNAL-IP   PORT(S)    AGE
prometheus-operated   ClusterIP   10.111.246.229   <none>        9090/TCP   38m
We will use this service to point Grafana to our desired data source.
From Home Dashboard, go to Configuration > Data Sources, and select Add data source. Select Prometheus as the data source type.
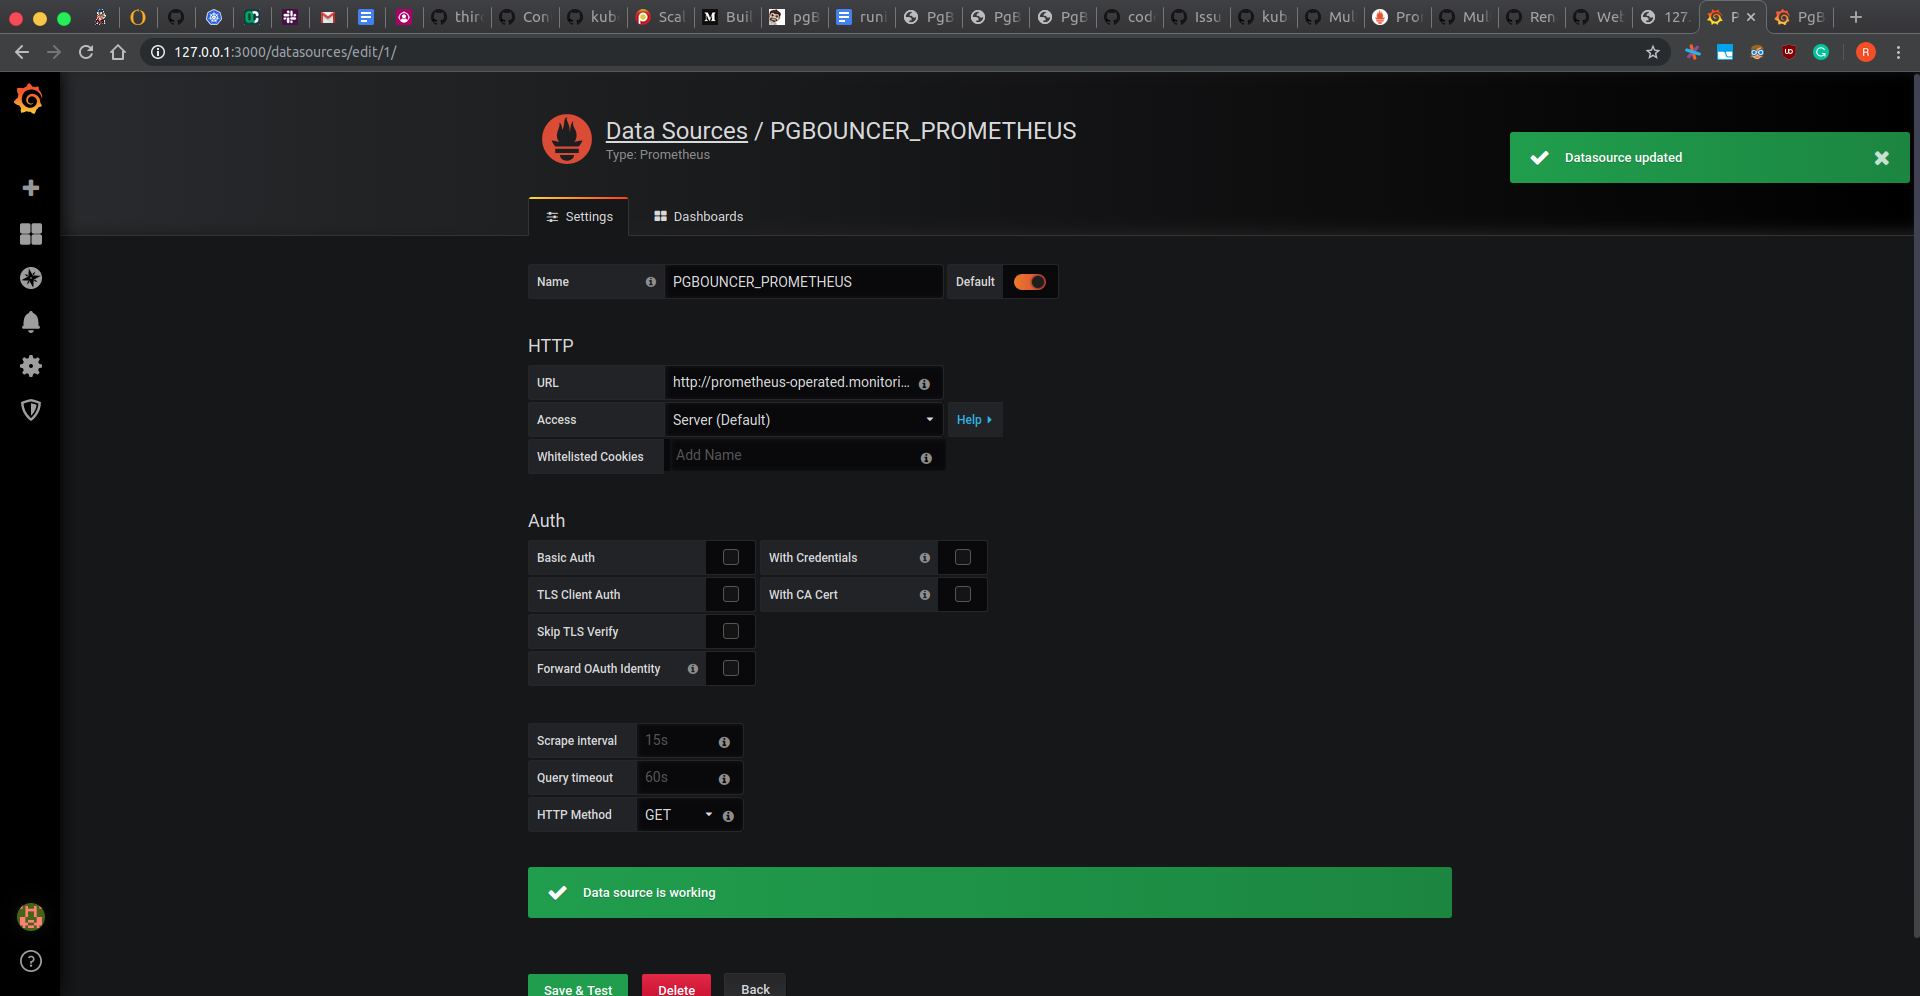
In the following screen, add http://prometheus-operated.monitoring.svc:9090 as the data source URL, give it a name PGBOUNCER_PROMETHEUS, and press the Save and Test button. You should get a message confirming that the Data source is working.

Import Dashboard
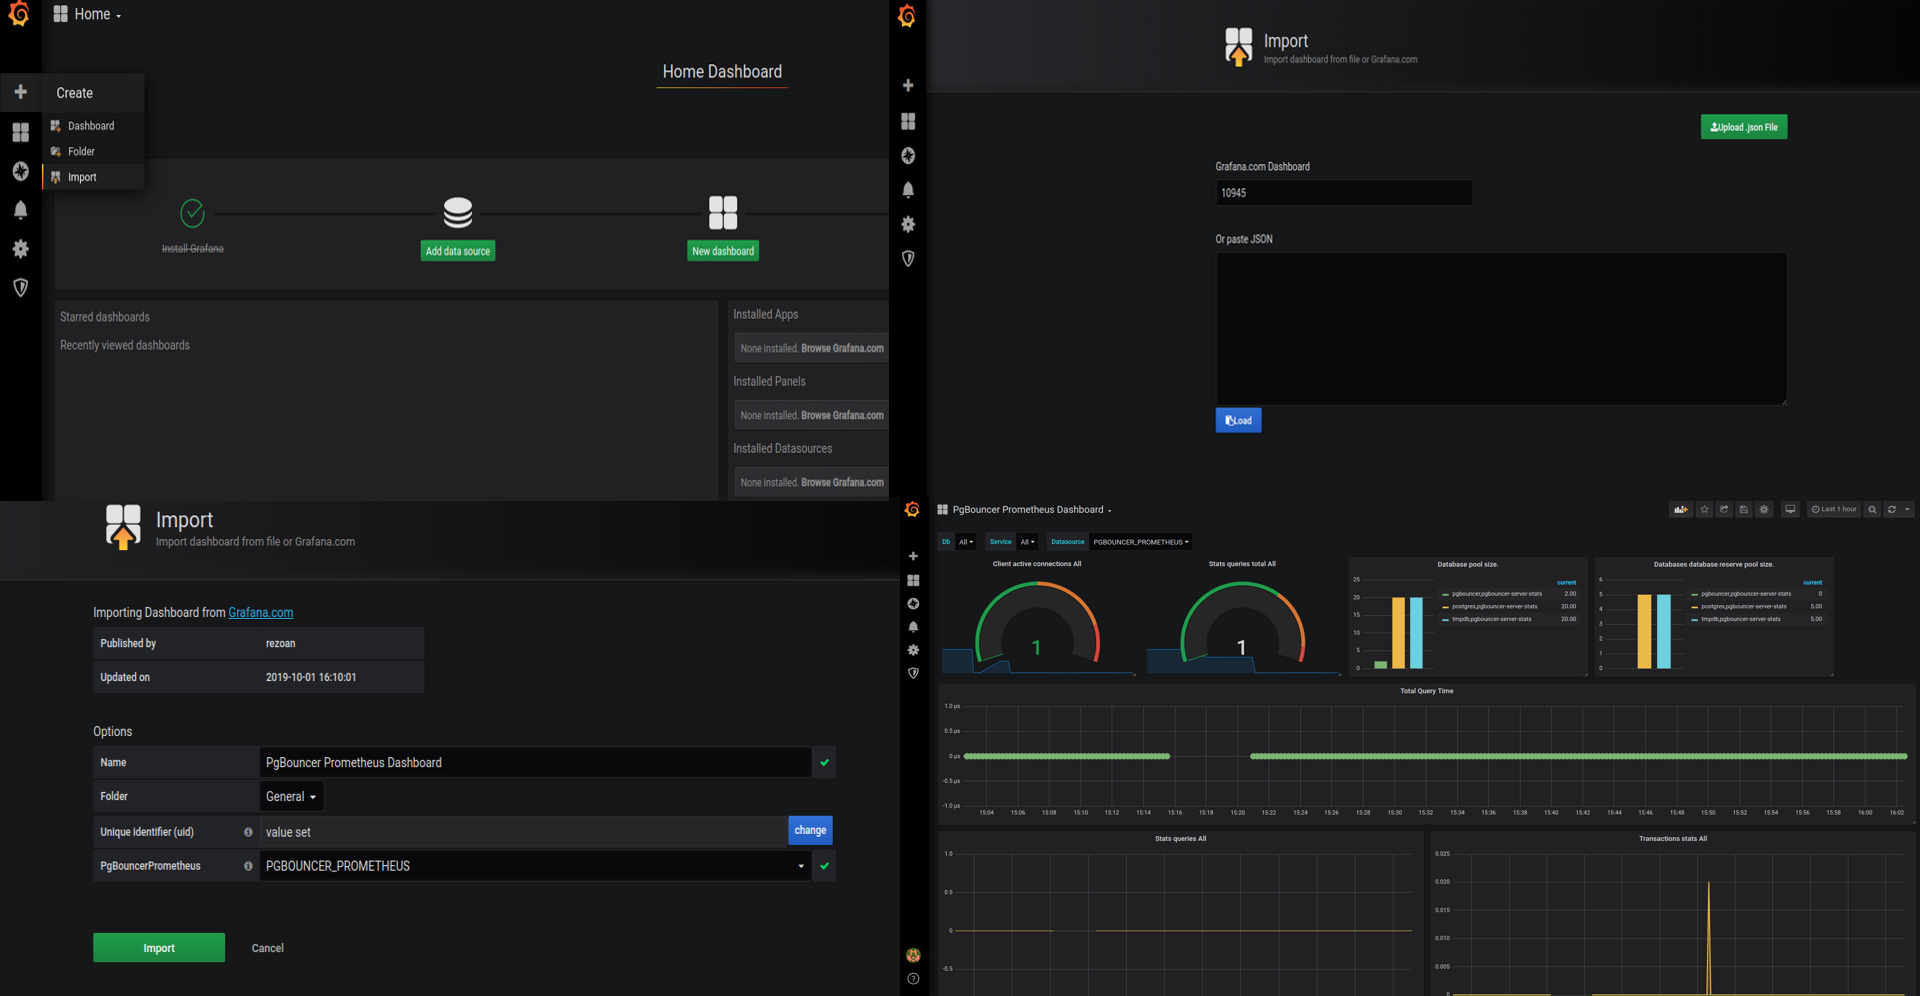
Now, go to http://localhost:3000/dashboard/import to import our PgBouncer Dashboard. Put 10945 as the grafana dashboard id. Select PGBOUNCER_PROMETHEUS as the data source, and press import. You will now be directed to your PgBouncer dashboard.

Cleaning up
To cleanup the Kubernetes resources created by this tutorial, run the following commands
# cleanup prometheus resources
kubectl delete -n monitoring deployment grafana

# delete namespace
kubectl delete ns monitoring
Next Steps
- Monitor your PgBouncer with KubeDB using built-in Prometheus.
- Monitor your PgBouncer with KubeDB using Prometheus operator.
- Want to hack on KubeDB? Check our contribution guidelines.


