You are looking at the documentation of a prior release. To read the documentation of the latest release, please
visit here.
New to KubeDB? Please start here.
Monitoring Apache Kafka with KubeDB
KubeDB has native support for monitoring via Prometheus. You can use builtin Prometheus scraper or Prometheus operator to monitor KubeDB managed databases. This tutorial will show you how database monitoring works with KubeDB and how to configure Database crd to enable monitoring.
Overview
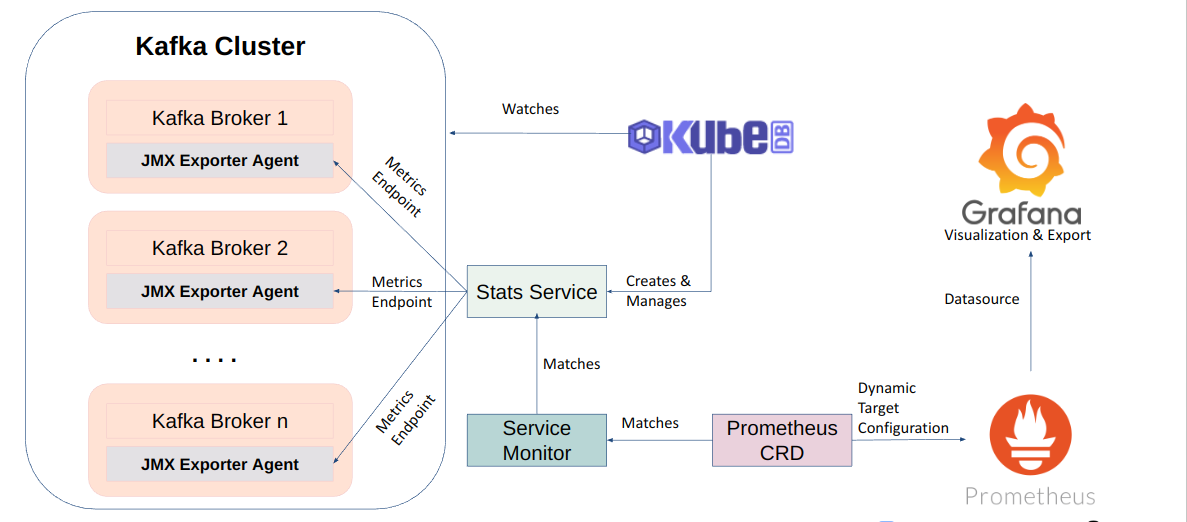
KubeDB uses Prometheus exporter images to export Prometheus metrics for respective databases. As KubeDB supports Kafka versions in KRaft mode, and the officially recognized exporter image doesn’t expose metrics for them yet - KubeDB managed Kafka instances use JMX Exporter instead. This exporter is intended to be run as a Java Agent inside Kafka container, exposing a HTTP server and serving metrics of the local JVM. To Following diagram shows the logical flow of database monitoring with KubeDB.

When a user creates a Kafka crd with spec.monitor section configured, KubeDB operator provisions the respective Kafka cluster while running the exporter as a Java agent inside the kafka containers. It also creates a dedicated stats service with name {database-crd-name}-stats for monitoring. Prometheus server can scrape metrics using this stats service.
Configure Monitoring
In order to enable monitoring for a database, you have to configure spec.monitor section. KubeDB provides following options to configure spec.monitor section:
| Field | Type | Uses |
|---|---|---|
spec.monitor.agent | Required | Type of the monitoring agent that will be used to monitor this database. It can be prometheus.io/builtin or prometheus.io/operator. |
spec.monitor.prometheus.exporter.port | Optional | Port number where the exporter side car will serve metrics. |
spec.monitor.prometheus.exporter.args | Optional | Arguments to pass to the exporter sidecar. |
spec.monitor.prometheus.exporter.env | Optional | List of environment variables to set in the exporter sidecar container. |
spec.monitor.prometheus.exporter.resources | Optional | Resources required by exporter sidecar container. |
spec.monitor.prometheus.exporter.securityContext | Optional | Security options the exporter should run with. |
spec.monitor.prometheus.serviceMonitor.labels | Optional | Labels for ServiceMonitor crd. |
spec.monitor.prometheus.serviceMonitor.interval | Optional | Interval at which metrics should be scraped. |
Sample Configuration
A sample YAML for TLS secured Kafka crd with spec.monitor section configured to enable monitoring with Prometheus operator is shown below.
apiVersion: kubedb.com/v1alpha2
kind: Kafka
metadata:
  name: kafka
  namespace: demo
spec:
  enableSSL: true
  tls:
    issuerRef:
      apiGroup: cert-manager.io
      name: kafka-ca-issuer
      kind: Issuer
  replicas: 3
  version: 3.6.1
  storage:
    accessModes:
      - ReadWriteOnce
    resources:
      requests:
        storage: 1Gi
    storageClassName: standard
  monitor:
    agent: prometheus.io/operator
    prometheus:
      exporter:
        port: 9091
      serviceMonitor:
        labels:
          release: prometheus
        interval: 10s
  storageType: Durable
  terminationPolicy: WipeOut
Let’s deploy the above example by the following command:
$ kubectl create -f https://github.com/kubedb/docs/raw/v2024.4.27/docs/examples/kafka/monitoring/kf-with-monitoring.yaml
kafka.kubedb.com/kafka created
Here, we have specified that we are going to monitor this server using Prometheus operator through spec.monitor.agent: prometheus.io/operator. KubeDB will create a ServiceMonitor crd in databases namespace and this ServiceMonitor will have release: prometheus label.
Next Steps
- Learn how to use KubeDB to run a Apache Kafka cluster here.
- Deploy dedicated topology cluster for Apache Kafka
- Deploy combined cluster for Apache Kafka
- Detail concepts of KafkaVersion object.
- Learn to use KubeDB managed Kafka objects using CLIs.
- Want to hack on KubeDB? Check our contribution guidelines.


